


Market Analysis: Gold Consolidates While WTI Crude Oil Faces Continued Struggles
FXOpen

Gold price is consolidating above the $2,600 support zone. Crude oil is showing bearish signs and might decline below $66.80.
Important Takeaways for Gold and Oil Prices Analysis Today
· Gold price started a recovery wave from the $2,610 zone against the US Dollar.
· A key bearish trend line is forming with resistance at $2,650 on the hourly chart of gold at FXOpen.
· Crude oil prices failed to clear the $70.00 region and started a fresh decline.
· There is a connecting bearish trend line forming with resistance at $67.50 on the hourly chart of XTI/USD at FXOpen.
Gold Price Technical Analysis
On the hourly chart of Gold at FXOpen, the price found support near the $2,610 zone. The price remained in a bullish zone and started a recovery wave above $2,620.
There was a decent move above the 50-hour simple moving average and $2,635. The bulls pushed the price above the $2,640 zone. Finally, the price climbed as high as $2,650 before the bears appeared. The price is now consolidating below $2,650.
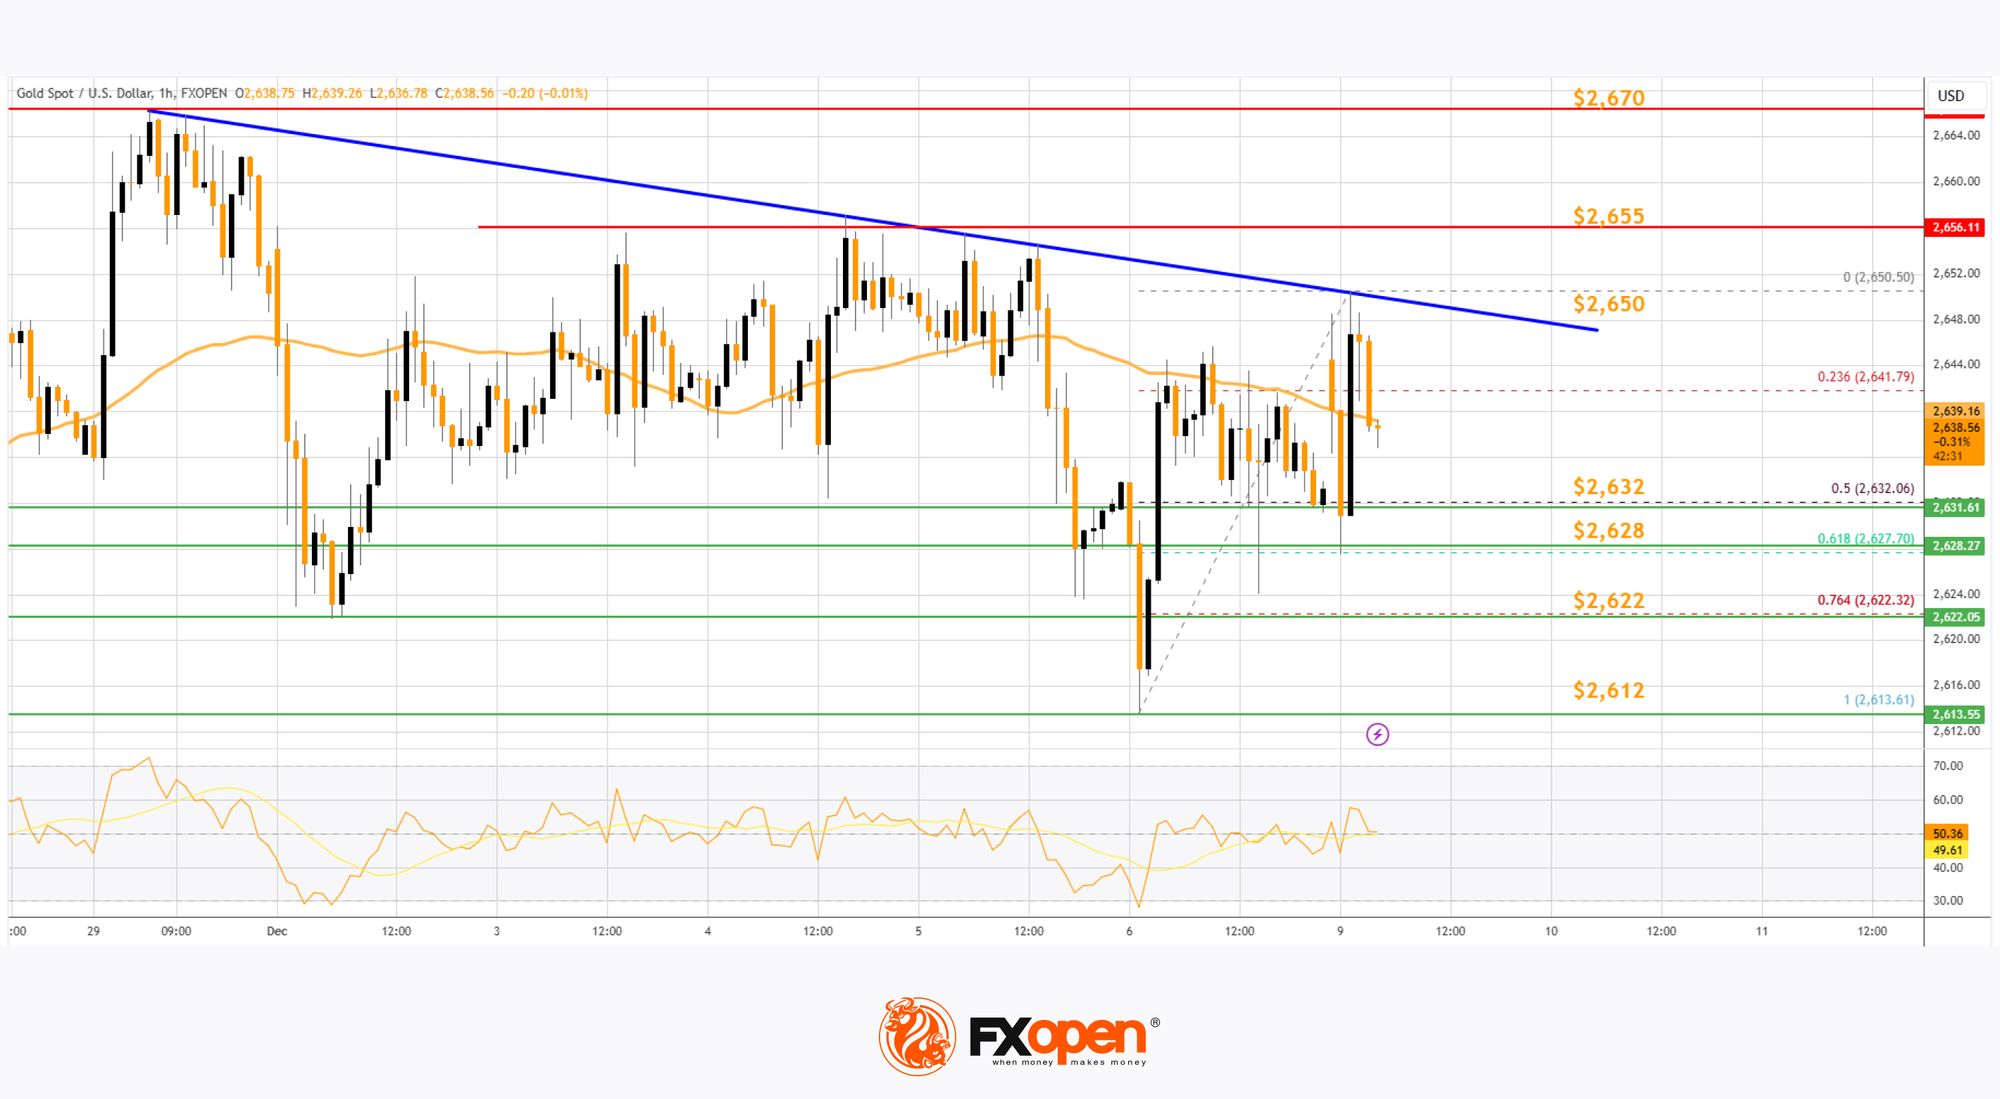
There was a move below the 23.6% Fib retracement level of the upward move from the $2,613 swing low to the $2,650 high, and the RSI is stable above 50.
Initial support on the downside is near $2,632. The first major support is near the $2,628 zone. It is near the 61.8% Fib retracement level of the upward move from the $2,613 swing low to the $2,650 high. If there is a downside break below the $2,628 support, the price might decline further.
In the stated case, the price might drop toward $2,612. Any more losses might push the price toward the $2,600 level. Immediate resistance is near the $2,650 level.
There is also a key bearish trend line forming with resistance at $2,650. The next major resistance is near the $2,655 level. An upside break above the $2,655 resistance could send Gold price toward $2,670. Any more gains may perhaps set the pace for an increase toward the $2,685 level.
Oil Price Technical Analysis
On the hourly chart of WTI Crude Oil at FXOpen, the price struggled to clear the $70.00 resistance zone against the US Dollar. The price started a fresh decline below the $68.80 support.
The price even dipped below the $67.80 level and the 50-hour simple moving average. The bulls are now active near the $66.80 level. A low was formed at $66.78 and the price is now consolidating losses. If there is a fresh increase, it could face resistance near the 23.6% Fib retracement level of the downward move from the $70.10 swing high to the $66.78 low.
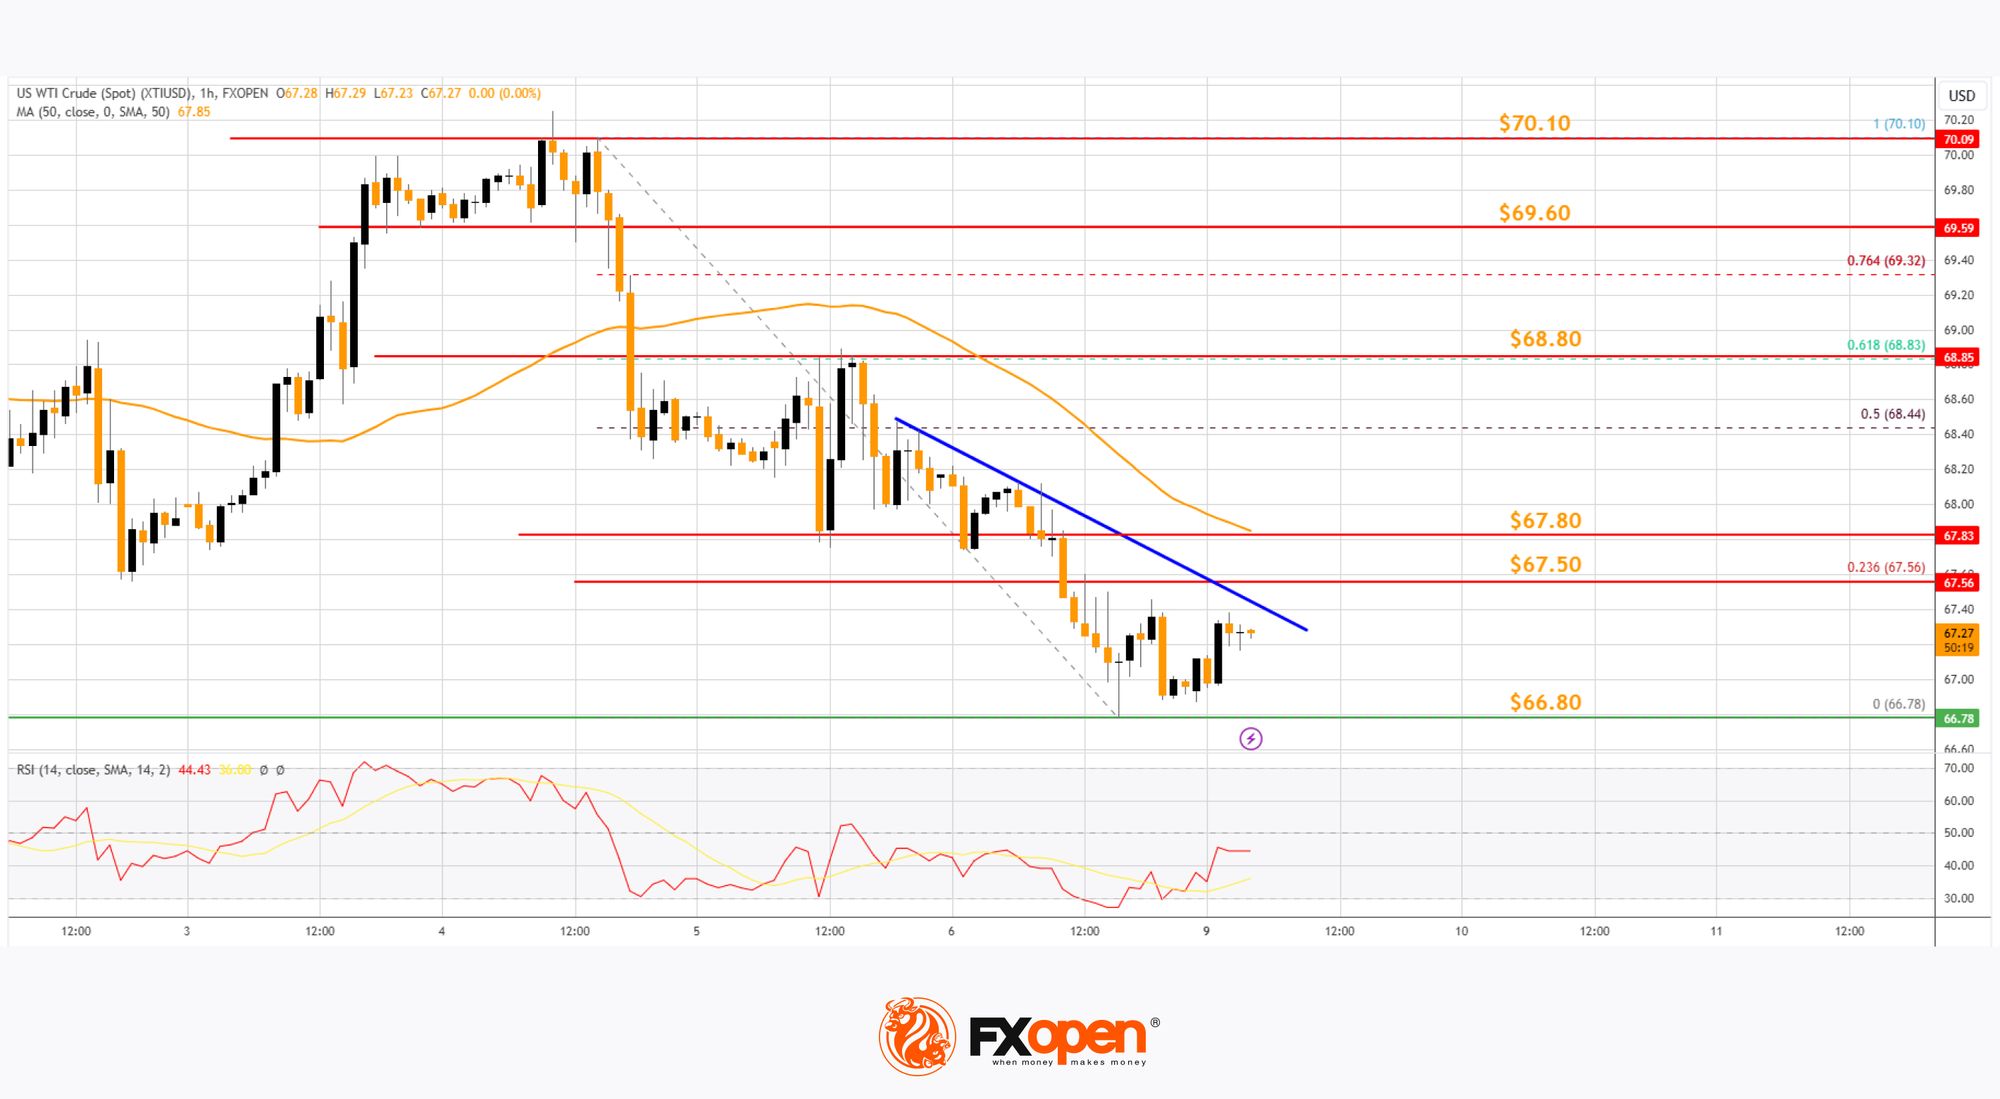
There is also a connecting bearish trend line forming with resistance at $67.50. The first major resistance is near the $67.80 level, above which the price could rise and test the 61.8% Fib retracement level of the downward move from the $70.10 swing high to the $66.78 low at $68.80.
Any more gains might send the price toward the $69.60 level. Conversely, the price might continue to move down and revisit the $66.80 support. The next major support on the WTI crude oil chart is $66.00.
If there is a downside break, the price might decline toward $63.50. Any more losses may perhaps open the doors for a move toward the $61.20 support zone.
Start trading commodity CFDs with tight spreads (additional fees may apply). Open your trading account now or learn more about trading commodity CFDs with FXOpen.
This article represents the opinion of the Companies operating under the FXOpen brand only. It is not to be construed as an offer, solicitation, or recommendation with respect to products and services provided by the Companies operating under the FXOpen brand, nor is it to be considered financial advice.
Stay ahead of the market!
Subscribe now to our mailing list and receive the latest market news and insights delivered directly to your inbox.


Latest articles

Nasdaq 100: 48 Hours of Chaos, One Trendline Standing in the Way
Wall Street just lived through one of its wildest 48 hours of the year. On Wednesday, the Fed held rates steady at 3.50%-3.75%, but three FOMC members broke ranks to demand a hike—an unusually hawkish dissent

Amazon Analysis: Strong Earnings Coincide with a Breakout from the Correction
On 30 July, Amazon.com reported its financial results for the second quarter of 2026, significantly exceeding market expectations. Revenue rose 20% year-on-year to $200.6 billion, compared with the consensus forecast of around $196.5 billion. The main growth

GBP/USD and EUR/GBP Await Key Bank of England Decision
The pound strengthened following the outcome of the US Federal Reserve meeting, where the central bank, as expected, kept interest rates unchanged. However, the Fed did not provide the market with clear signals of an imminent shift towards rate cuts,