


Nasdaq 100: 48 Hours of Chaos, One Trendline Standing in the Way
FXOpen

Wall Street just lived through one of its wildest 48 hours of the year. On Wednesday, the Fed held rates steady at 3.50%-3.75%, but three FOMC members broke ranks to demand a hike—an unusually hawkish dissent that sent the Dow plunging over 1,100 points, its worst session since April 2025. Treasury yields spiked, with the 30-year touching levels unseen since 2007, as renewed US-Iran strikes pushed oil higher and reignited inflation fears. The Nasdaq 100 (US Tech 100 Mini on FXOpen) briefly slid into correction territory, down ~11% from its June record high.
Then came the reversal. Thursday's blockbuster earnings from Microsoft, whose Azure cloud business surged, alongside a rebound in beaten-down semiconductor stocks, powered the Nasdaq 100 (US Tech 100 Mini on FXOpen) to a 3.36% gain, snapping a six-day losing streak.
The whiplash captures the market's core dilemma perfectly: a Fed chair in Kevin Warsh determined to prove his inflation-fighting credentials, a Middle East conflict refusing to fade, and a tech sector whose AI-driven earnings power may be the only thing strong enough to override both.
Technical Analysis of the Nasdaq 100 Chart
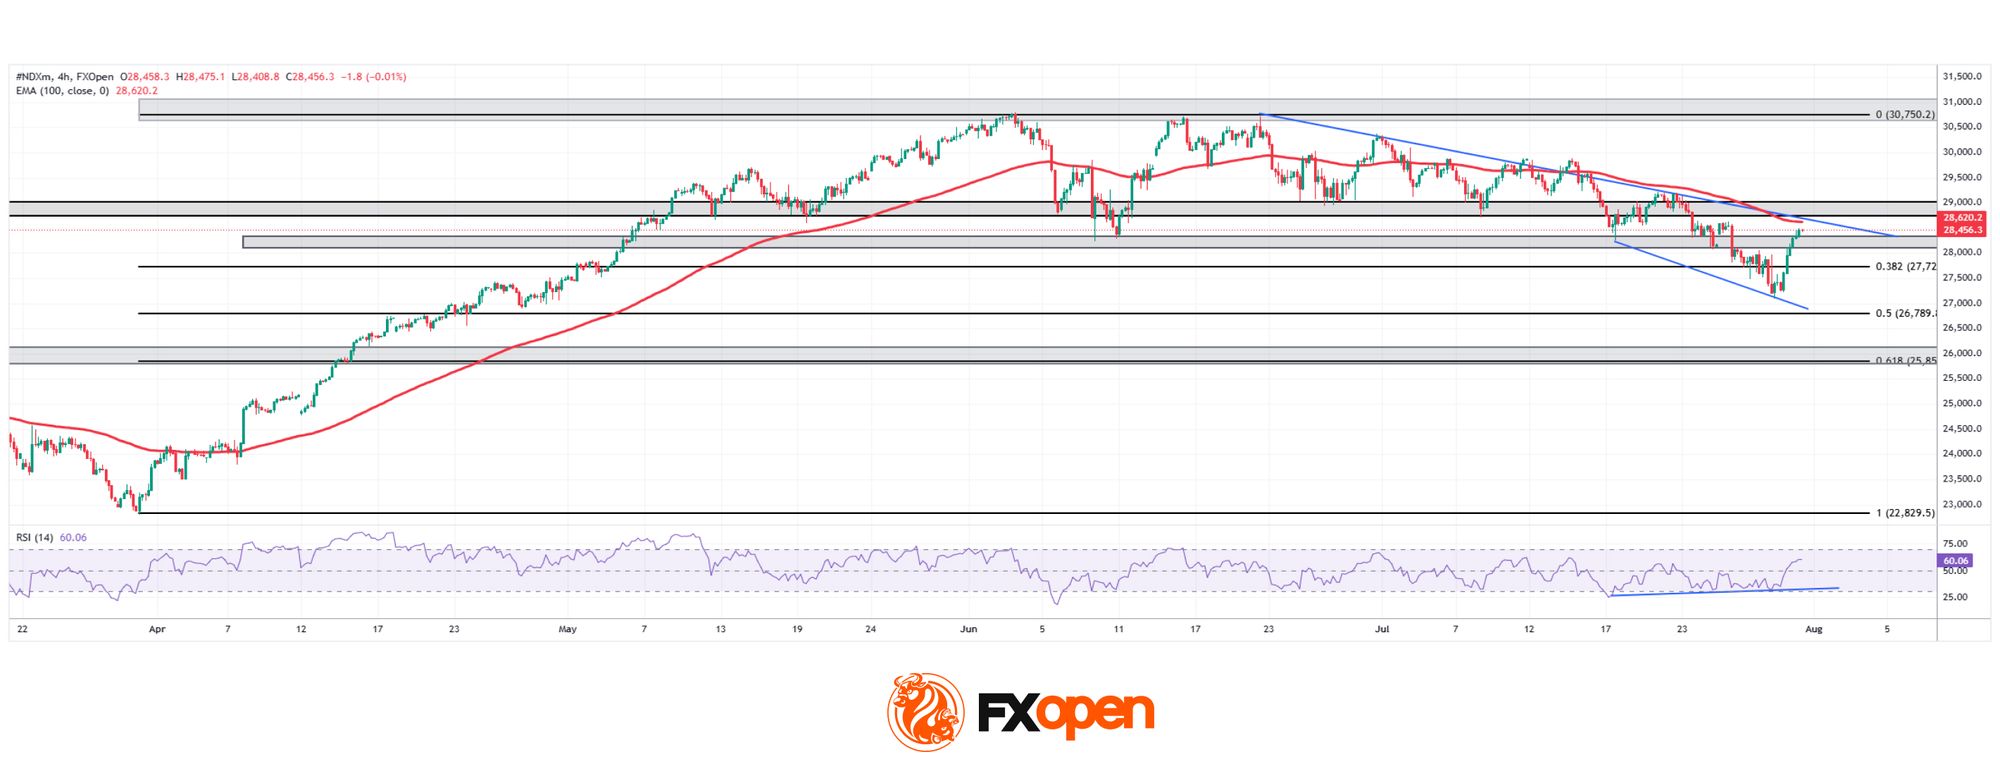
As the chart shows, the Nasdaq 100 (US Tech 100 Mini on FXOpen) is currently testing the descending trendline that has guided its decline from late June's highs, with price also pressing against the 100-period EMA near 28,620, a confluence that has repeatedly capped rallies over the past several sessions. Adding weight to this setup, the RSI is showing a bullish divergence, printing higher lows even as price carved a fresh low in late July.
Bullish Scenario
Should buyers finally break above both the descending trendline and the 100-period EMA, the divergence would gain real technical credibility, opening the path toward the 28,800-29,000 resistance zone and, beyond that, a retest of the 30,750 highs from June.
Bearish Scenario
Conversely, a rejection at this trendline-EMA confluence would invalidate the bullish divergence for now, sending price back toward the 27,720 area, the 0.382 Fibonacci retracement of the March-June rally. A deeper break would expose the 0.5 and 0.618 retracements near 26,789 and 25,850, levels that previously acted as key support during the spring advance.
With price coiled right beneath a trendline it has yet to conquer, and the RSI quietly hinting at renewed strength underneath, the Nasdaq 100 chart (US Tech 100 Mini on FXOpen) looks ready to answer the question markets have been asking all week: was this correction just noise, or the start of something bigger?
Trade global index CFDs with zero commission and tight spreads (additional fees may apply). Open your FXOpen account now or learn more about trading index CFDs with FXOpen.
This article represents the opinion of the Companies operating under the FXOpen brand only. It is not to be construed as an offer, solicitation, or recommendation with respect to products and services provided by the Companies operating under the FXOpen brand, nor is it to be considered financial advice.
Stay ahead of the market!
Subscribe now to our mailing list and receive the latest market news and insights delivered directly to your inbox.


Latest articles

CAD/JPY: The Yen's Most Historic Move in 30 Years Meets a Fragile Support
Two central banks are heading in genuinely opposite directions this week, and the tension is unmistakable. The Bank of Canada held rates steady at 2.25% on September 2, with a mildly hawkish tilt as policymakers acknowledged a broadening economic

USD/JPY and USD/CAD Await Key Fed Decision
The US dollar is consolidating against the yen and Canadian dollar ahead of the key event of the week — the Federal Reserve meeting. The Fed is widely expected to raise its policy rate by 25 basis points to a range

UnitedHealth: Fundamentals Are Healing, Now the Chart Must Agree
UnitedHealth finds itself in a genuinely split narrative right now, trading near $388, down about 15.9% from its 52-week high, even as the fundamental picture keeps improving. Q2 earnings beat expectations, with revenue of $112.03 billion, and the