


FXOpen

Gold price is moving lower below the $2,025 support. Crude oil price is correcting gains and might decline toward the $68.85 support.
Important Takeaways for Gold and Oil Prices Analysis Today
· Gold price failed to clear the $2,060 resistance and corrected gains against the US Dollar.
· It broke a key contracting triangle with support near $2,025 on the hourly chart of gold at FXOpen.
· Crude oil prices are also moving lower below $72.00 and $71.50 levels.
· There was a break below a major bullish trend line with support near $73.00 on the hourly chart of XTI/USD at FXOpen.
Gold Price Technical Analysis
On the hourly chart of Gold at FXOpen, the price traded to a new all-time high before it started a downside correction. The price declined below the $2,060 level to move into a bearish zone.
The last swing high was near $2,048 and the price is now trading below the 50-hour simple moving average. It traded below a key contracting triangle with support near $2,025. The price is now trading below the 61.8% Fib retracement level of the upward move from the $1,999 swing low to the $2,048 high.
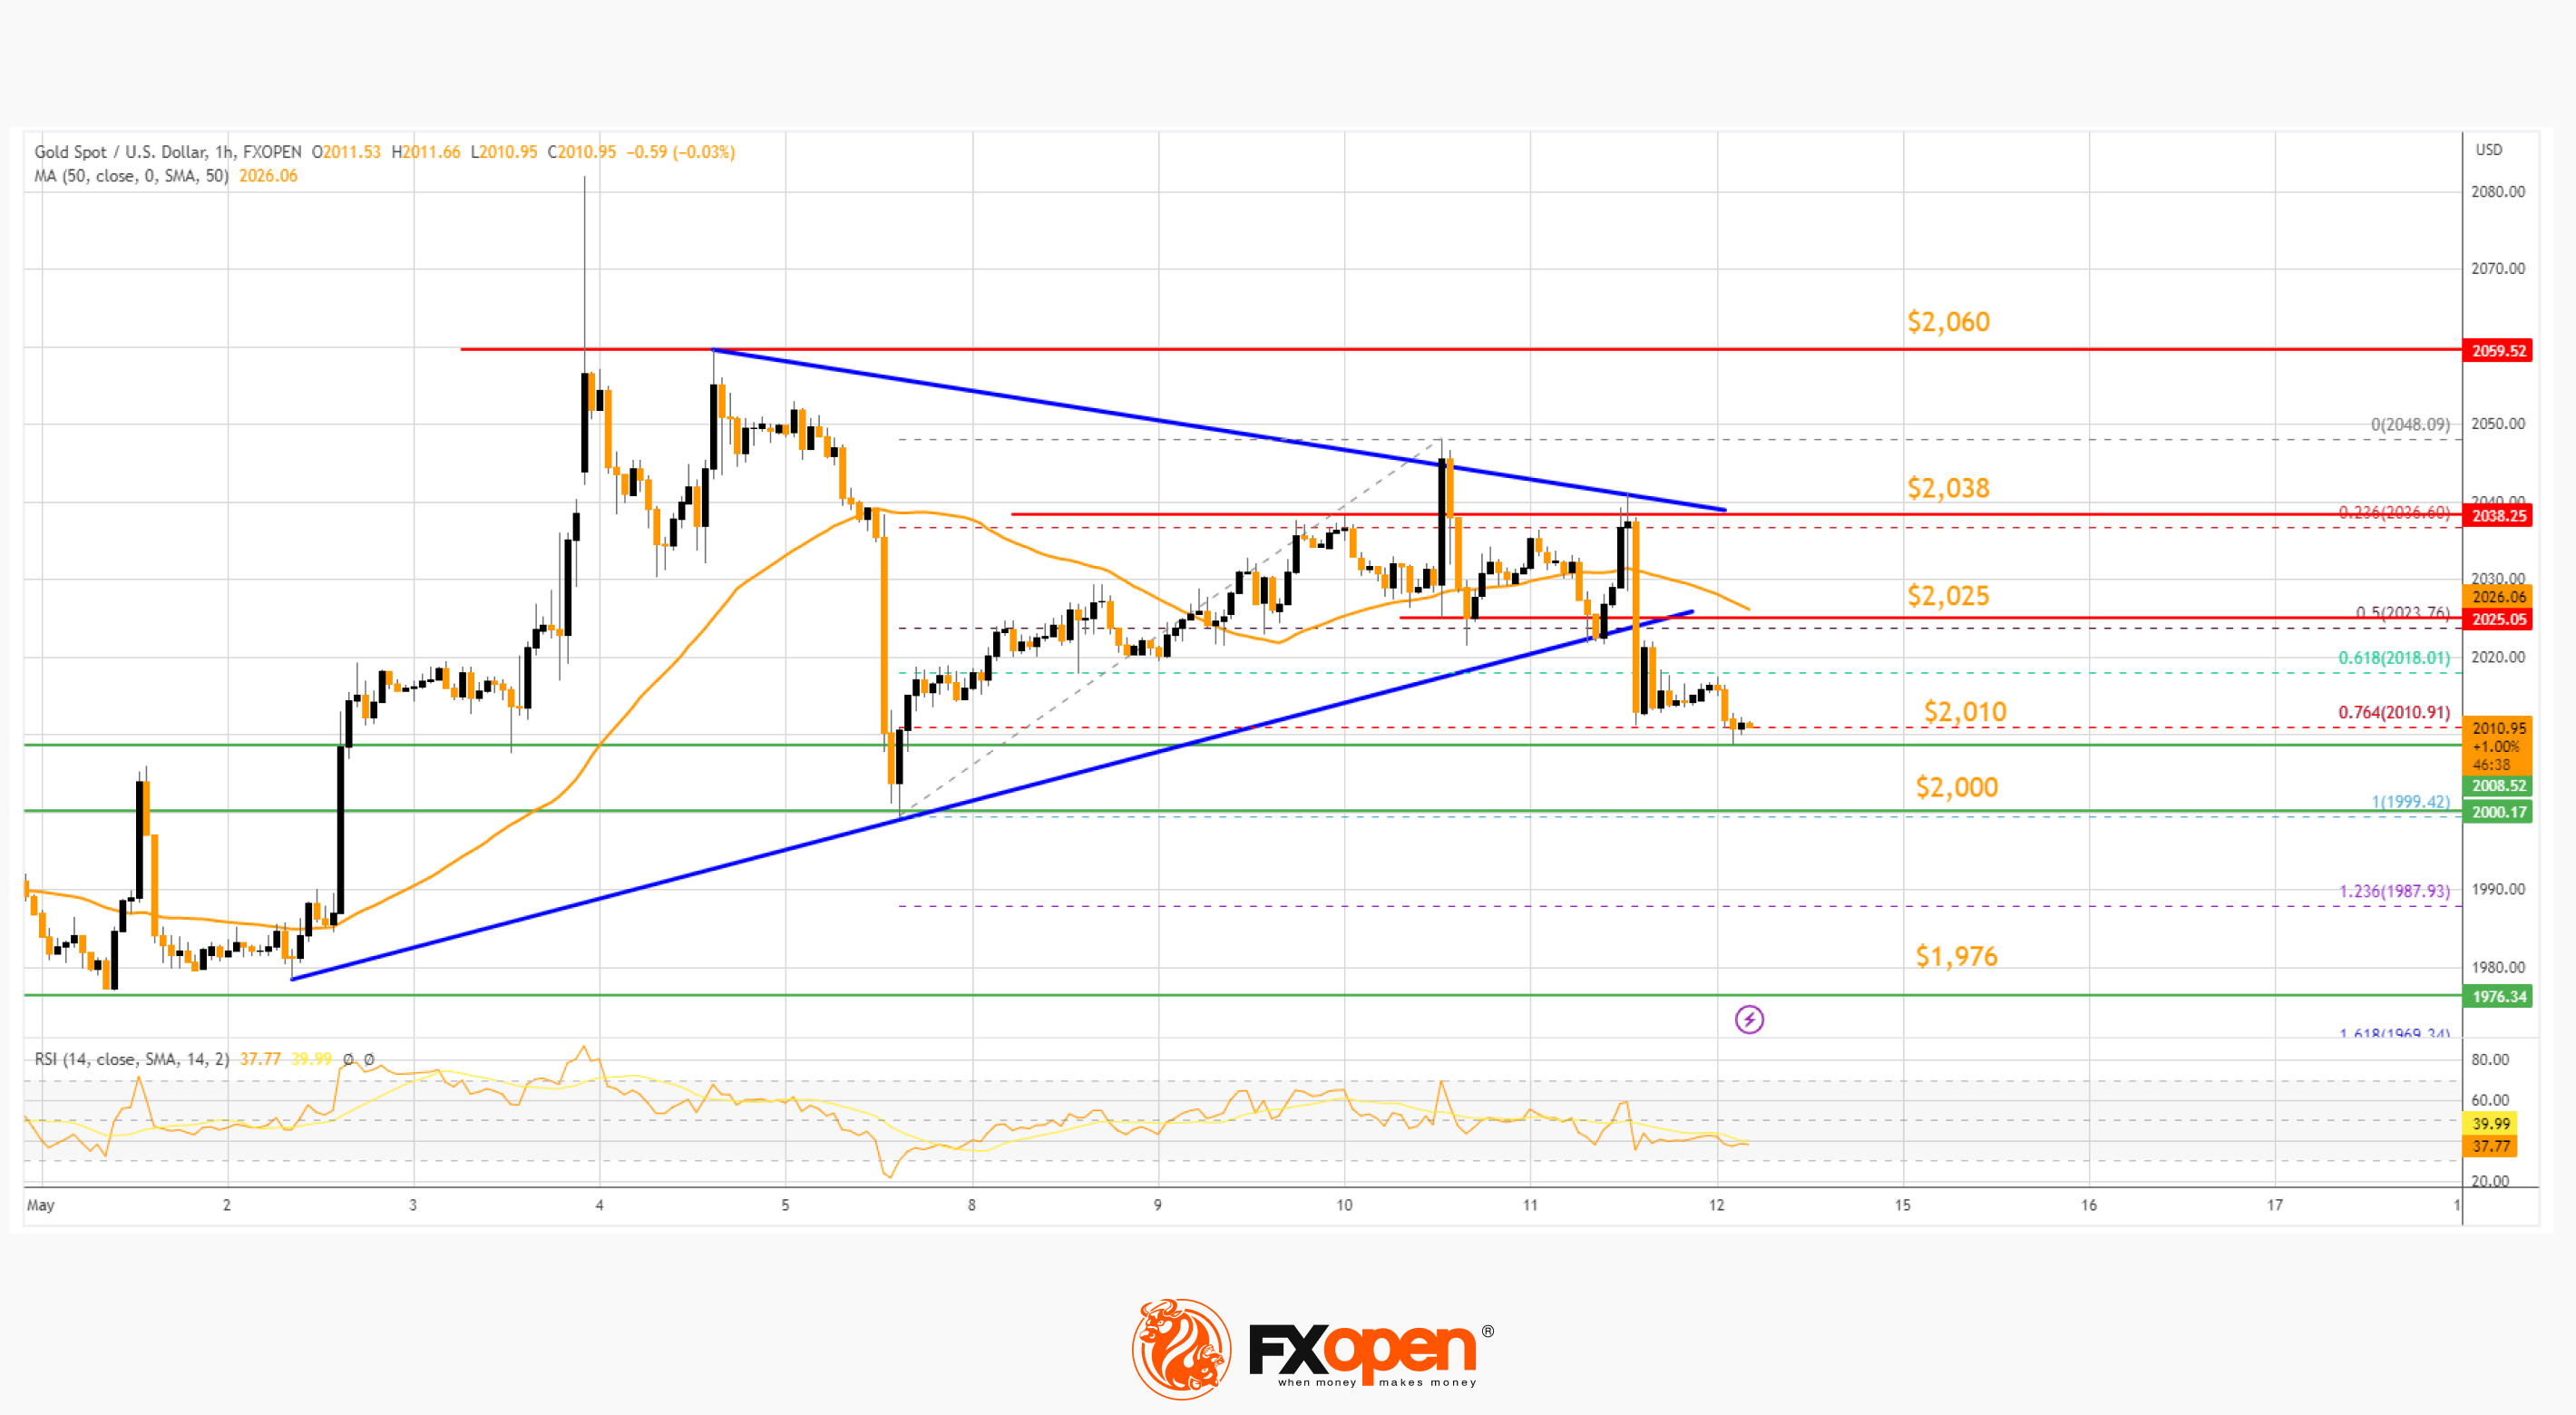
Initial support on the downside is near the 76.4% Fib retracement level of the upward move from the $1,999 swing low to the $2,048 high at $2,010.
The first major support is near the $2,000 level. The main support sits near the $1,976 level. If there is a downside break below the $1,976 support, the price might decline heavily.
The next major support is near $1,955, below which the bulls could aim for a test of $1,932. On the upside, the bulls are facing resistance near the 50-hour simple moving average at $2,025. The next major resistance is near the $2,038 level.
An upside break above the $2,038 resistance could send Gold price toward $2,060. Any more gains may perhaps set the pace for an increase toward the $2,080 level.
Oil Price Technical Analysis
On the hourly chart of WTI Crude Oil at FXOpen, the price struggled to recover further above the $74 resistance against the US Dollar. A high was formed near $73.79 and there was a downward move.
There was a break below a major bullish trend line with support near $73.00. The price declined below the 50-hour simple moving average at $72 and RSI dropped to 30. It is now showing bearish signs below the 23.6% Fib retracement level of the upward move from the $63.90 swing low to the $73.79 high.
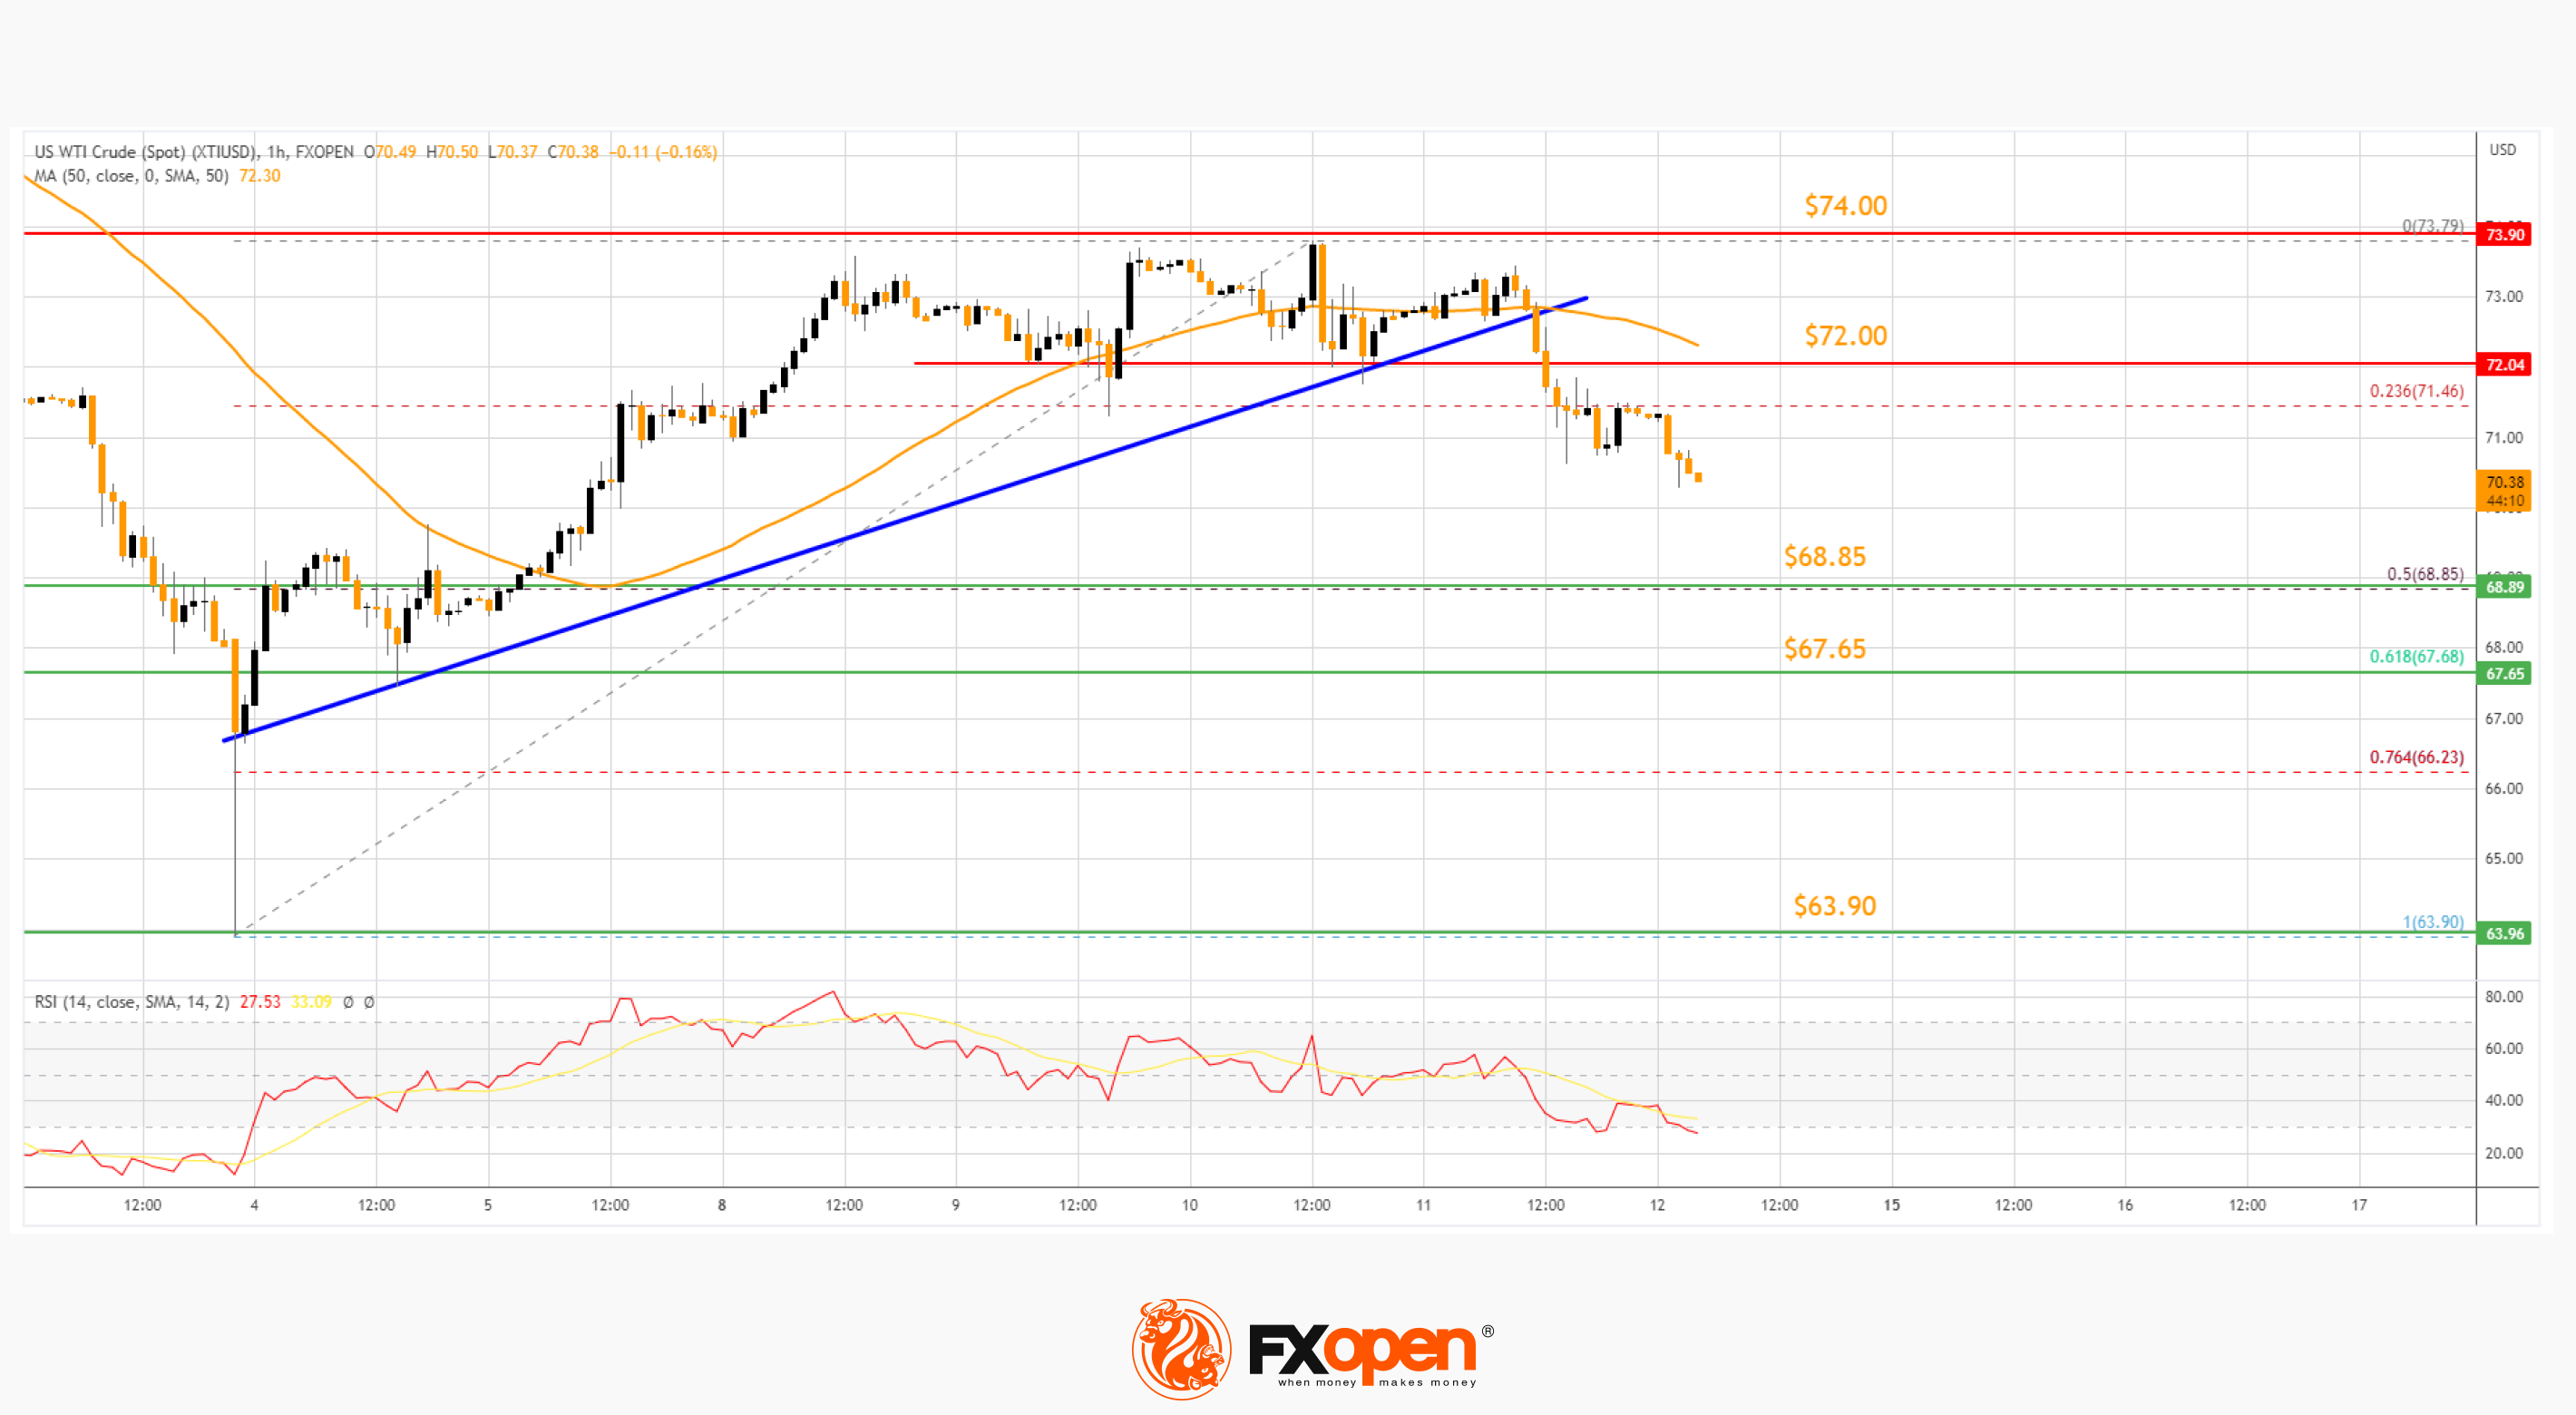
On the downside, support is near the 50% Fib retracement level of the upward move from the $63.90 swing low to the $73.79 high at $68.85.
The next major support on the WTI crude oil chart is near $67.65. If there is a downside break, the price might decline toward $63.90. Any more losses may perhaps open the doors for a move toward the $60.00 support zone.
On the upside, the price could struggle near the 50-hour simple moving average at $72.00. The first major resistance is near the $74.00 zone, above which the price might accelerate higher toward $76.00. Any more gains might send the price toward the $80.00 level in the coming days.
Start trading commodity CFDs with tight spreads (additional fees may apply). Open your trading account now or learn more about trading commodity CFDs with FXOpen.
This article represents the opinion of the Companies operating under the FXOpen brand only. It is not to be construed as an offer, solicitation, or recommendation with respect to products and services provided by the Companies operating under the FXOpen brand, nor is it to be considered financial advice.
Stay ahead of the market!
Subscribe now to our mailing list and receive the latest market news and insights delivered directly to your inbox.


Latest articles

Consolidation Ahead of NFP: Commodity Currencies Search for Direction
Commodity-linked currencies have entered a consolidation phase following recent directional moves, as market participants adopt a wait-and-see approach ahead of key US labour market data. Current price action reflects a balance between ongoing demand for the US dollar and attempts

The Real Driver Behind the Dollar Rally: Market Insights with Gary Thomson
The US dollar has been firm, but the drivers behind the move may be more complex than they first appear.
While geopolitical tension and shifts in risk sentiment play a role, current price behaviour seems increasingly influenced by inflation expectations

EUR/USD and USD/CHF Pull Back: Market Reacts to Fundamentals
European currencies have shown a recovery in recent trading sessions after their recent decline, displaying early signs of a reversal. The US dollar is weakening amid expectations surrounding upcoming US macroeconomic data, while market participants are reassessing their short-term positions