


Market Analysis: Gold Price Regains Strength While Crude Oil Price Recovers
FXOpen

The gold price started a fresh increase above $2,320. Crude oil is recovering and might rise toward the $81.20 resistance zone.
Important Takeaways for Gold and Oil Price Analysis Today
- The gold price started a decent increase from the $2,300 zone against the US Dollar.
- It broke a key descending channel with resistance at $2,315 on the hourly chart of gold at FXOpen.
- Crude oil is recovering losses and trading above the $78.55 support.
- There was a break above a connecting bearish trendline with resistance near $78.40 on the hourly chart of XTI/USD at FXOpen.
Gold Price Technical Analysis
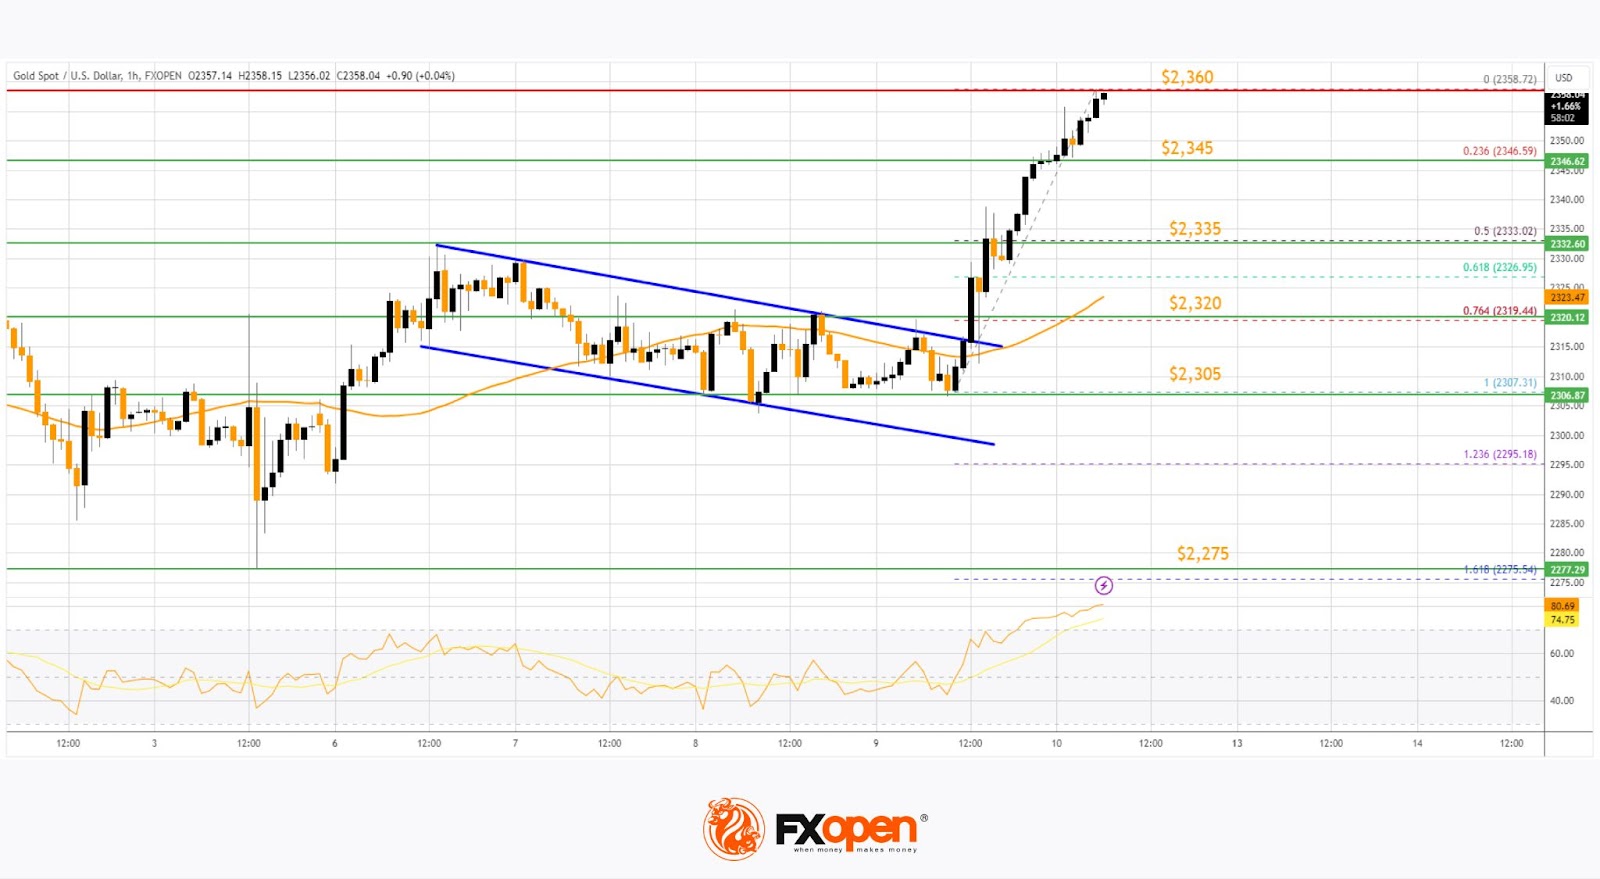
On the hourly chart of XAU/USD at FXOpen, the price formed support near the $2,275 zone, remained in a bullish zone, and started a strong increase above $2,300.
It broke a key descending channel with resistance at $2,315. The bulls even pushed the price above the $2,345 level and the 50-hour simple moving average. Finally, it traded as high as $2,358. XAU/USD is now consolidating gains near the $2,355 zone, and the RSI is above 70.
Initial support on the downside is near the 23.6% Fib retracement level of the upward move from the $2,307 swing low to the $2,358 high at $2,345.
The first major support is near the $2,335 zone. It is close to the 50% Fib retracement level of the upward move from the $2,307 swing low to the $2,358 high. If there is a downside break below the $2,335 support, the price might decline further.
In the stated case, the price might drop toward $2,320 and the 50-hour simple moving average.
Immediate resistance is near the $2,360 level. The next major resistance is near the $2,372 level. An upside break above the $2,372 resistance could send the gold price toward $2,385. Any more gains may perhaps set the pace for an increase toward the $2,400 level.
Oil Price Technical Analysis
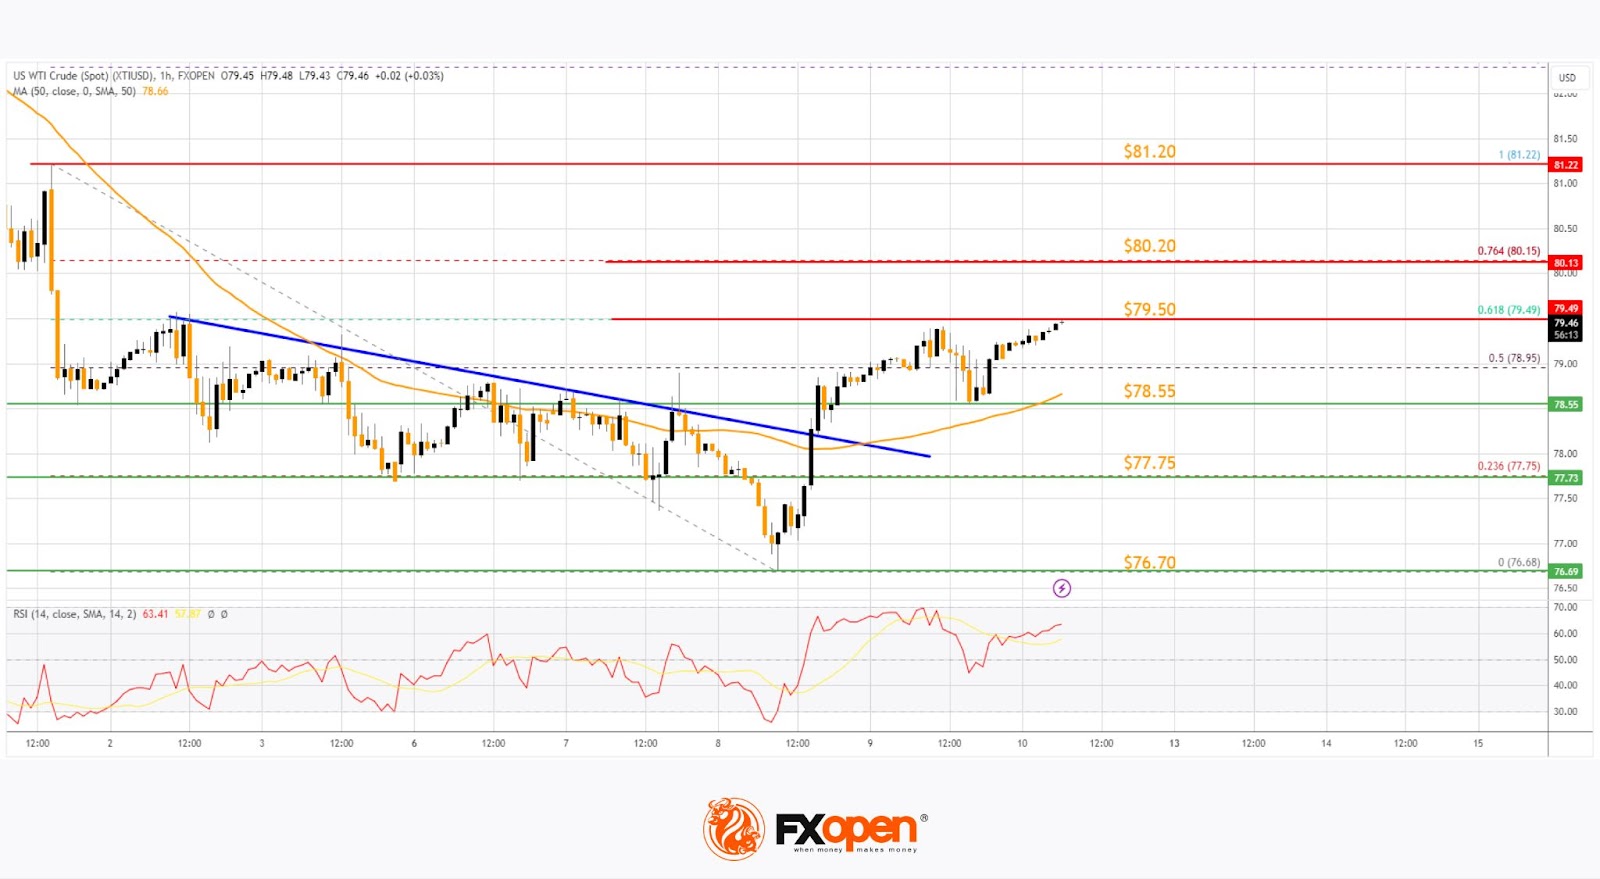
On the FXOpen hourly chart of WTI Crude Oil, the price found support near the $76.70 zone, formed a base, and started a recovery wave above $77.75 and the 50-hour simple moving average.
The bulls were able to push the price above the 50% Fib retracement level of the downward move from the $81.22 swing high to the $76.68 swing low. Besides, there was a break above a connecting bearish trendline with a resistance near $78.40.
The hourly RSI is near the 65 level, but the price is struggling near $79.50. It is close to the 61.8% Fib retracement level of the downward move from the $81.22 swing high to the $76.68 swing low.
A clear move above $79.50 could send the price toward the $81.20 resistance. Any more gains might send the price toward the $83.00 level. Conversely, the price might start a fresh decline from the $79.50 resistance.
Immediate support sits near $78.55. The next major support on the WTI crude oil chart is $77.75. If there is a downside break, the price might decline toward $76.70. Any more losses may perhaps open the doors for a move toward the $75.00 support zone.
Start trading commodity CFDs with tight spreads (additional fees may apply). Open your trading account now or learn more about trading commodity CFDs with FXOpen.
This article represents the opinion of the Companies operating under the FXOpen brand only. It is not to be construed as an offer, solicitation, or recommendation with respect to products and services provided by the Companies operating under the FXOpen brand, nor is it to be considered financial advice.
Stay ahead of the market!
Subscribe now to our mailing list and receive the latest market news and insights delivered directly to your inbox.


Latest articles

Ethereum: Has the Recovery Begun?
Ethereum has staged a notable rebound after once again testing the heavily watched psychological zone around 1500$. Since bouncing off this support, ETH/USD has climbed roughly 13%, now trading around the $1,700 mark.
This recovery is being driven

Oil Prices Are Back at Pre-Conflict Levels. Analysts Are Divided
At the start of May, oil markets were still pricing in elevated geopolitical risk and expectations of sustained supply disruption.
But easing tensions between Washington and Tehran, along with improving supply expectations, have rapidly shifted sentiment back toward fundamentals.
📉 Brent

The Dollar Awaits the Week’s Key Report: AUD/USD and NZD/USD at Crucial Technical Levels
Following mixed performance by the US dollar earlier this week, investors are now fully focused on the June Nonfarm Payrolls report, which will be released on Thursday rather than Friday. The schedule has been brought forward as US financial markets