FXOpen

Gold price is correcting gains below the $2,050 support. Crude oil prices declined steadily below the $75.90 support and moved into a bearish zone.
Important Takeaways for Gold and Oil Prices Analysis Today
· Gold price rallied to new highs above $2,120 before it corrected lower against the US Dollar.
· A key bearish trend line is forming with resistance near $2,025 on the hourly chart of gold at FXOpen.
· Crude oil prices extended downsides below the $75 support zone.
· A major bearish trend line is forming with resistance near $73.35 on the hourly chart of XTI/USD at FXOpen.
Gold Price Technical Analysis
On the hourly chart of Gold at FXOpen, the price rallied heavily above the $2,000 resistance. The price even traded to a new high at $2,135 before there was a downside correction.
There was a move below the $2,072 support level. The bears even pushed the price below the $2,050 support and the 50-hour simple moving average. It tested the $2,010 zone. A low is formed near $2,009.78 and the price is now attempting a fresh increase.
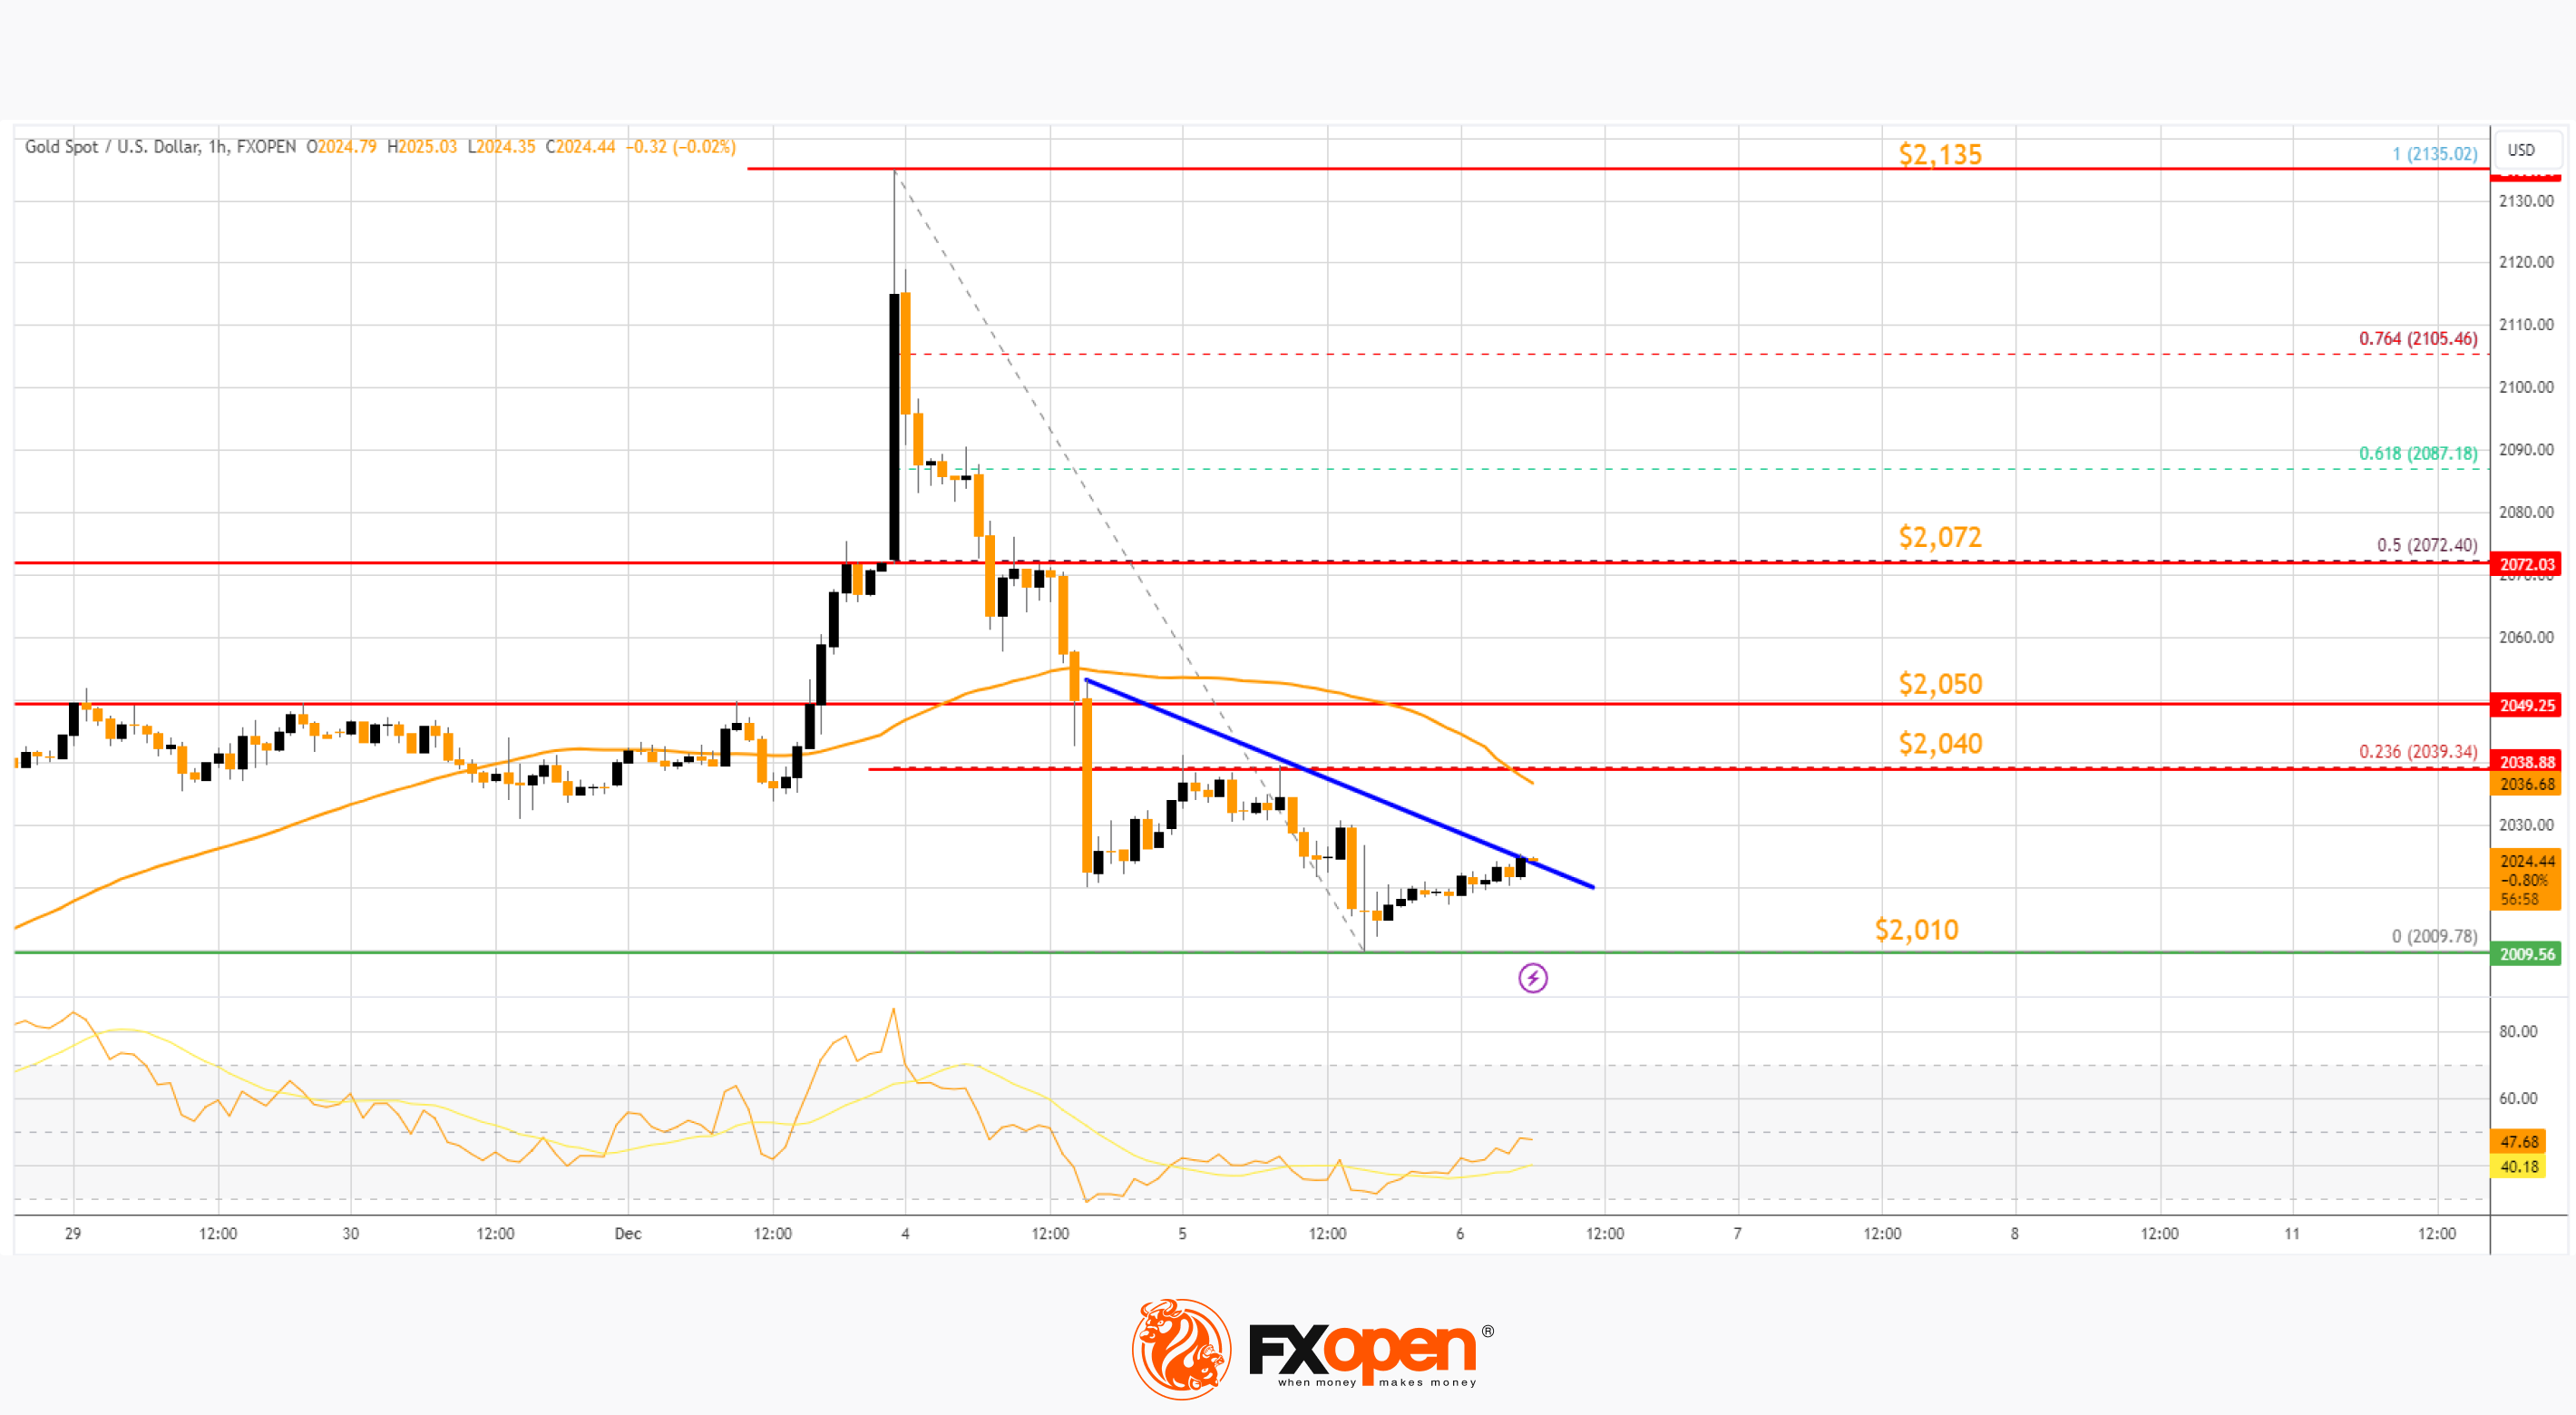
It is now facing resistance near a key bearish trend line at $2,025. The next major resistance is near the 23.6% Fib retracement level of the downward move from the $2,135 swing high to the $2,009 low at $2,040.
The main resistance could be $2,050, above which the price could test the $2,072 resistance. The next major resistance is $2,135. An upside break above the $2,135 resistance could send Gold price toward $2,220. Any more gains may perhaps set the pace for an increase toward the $2,350 level.
Initial support on the downside is near the $2,010 level. The first major support is near the $2,000 level. If there is a downside break below the $2,000 support, the price might decline further. In the stated case, the price might drop toward the $1,965 support.
Oil Price Technical Analysis
On the hourly chart of WTI Crude Oil at FXOpen, the price struggled to continue higher above $80.00 against the US Dollar. The price formed a short-term top and started a fresh decline below $78.00.
There was a steady decline below the $75.90 pivot level. The bears even pushed the price below $73.90 and the 50-hour simple moving average. Finally, the price tested the $72.15 zone. A low was formed near $72.14, and the price is now consolidating losses.
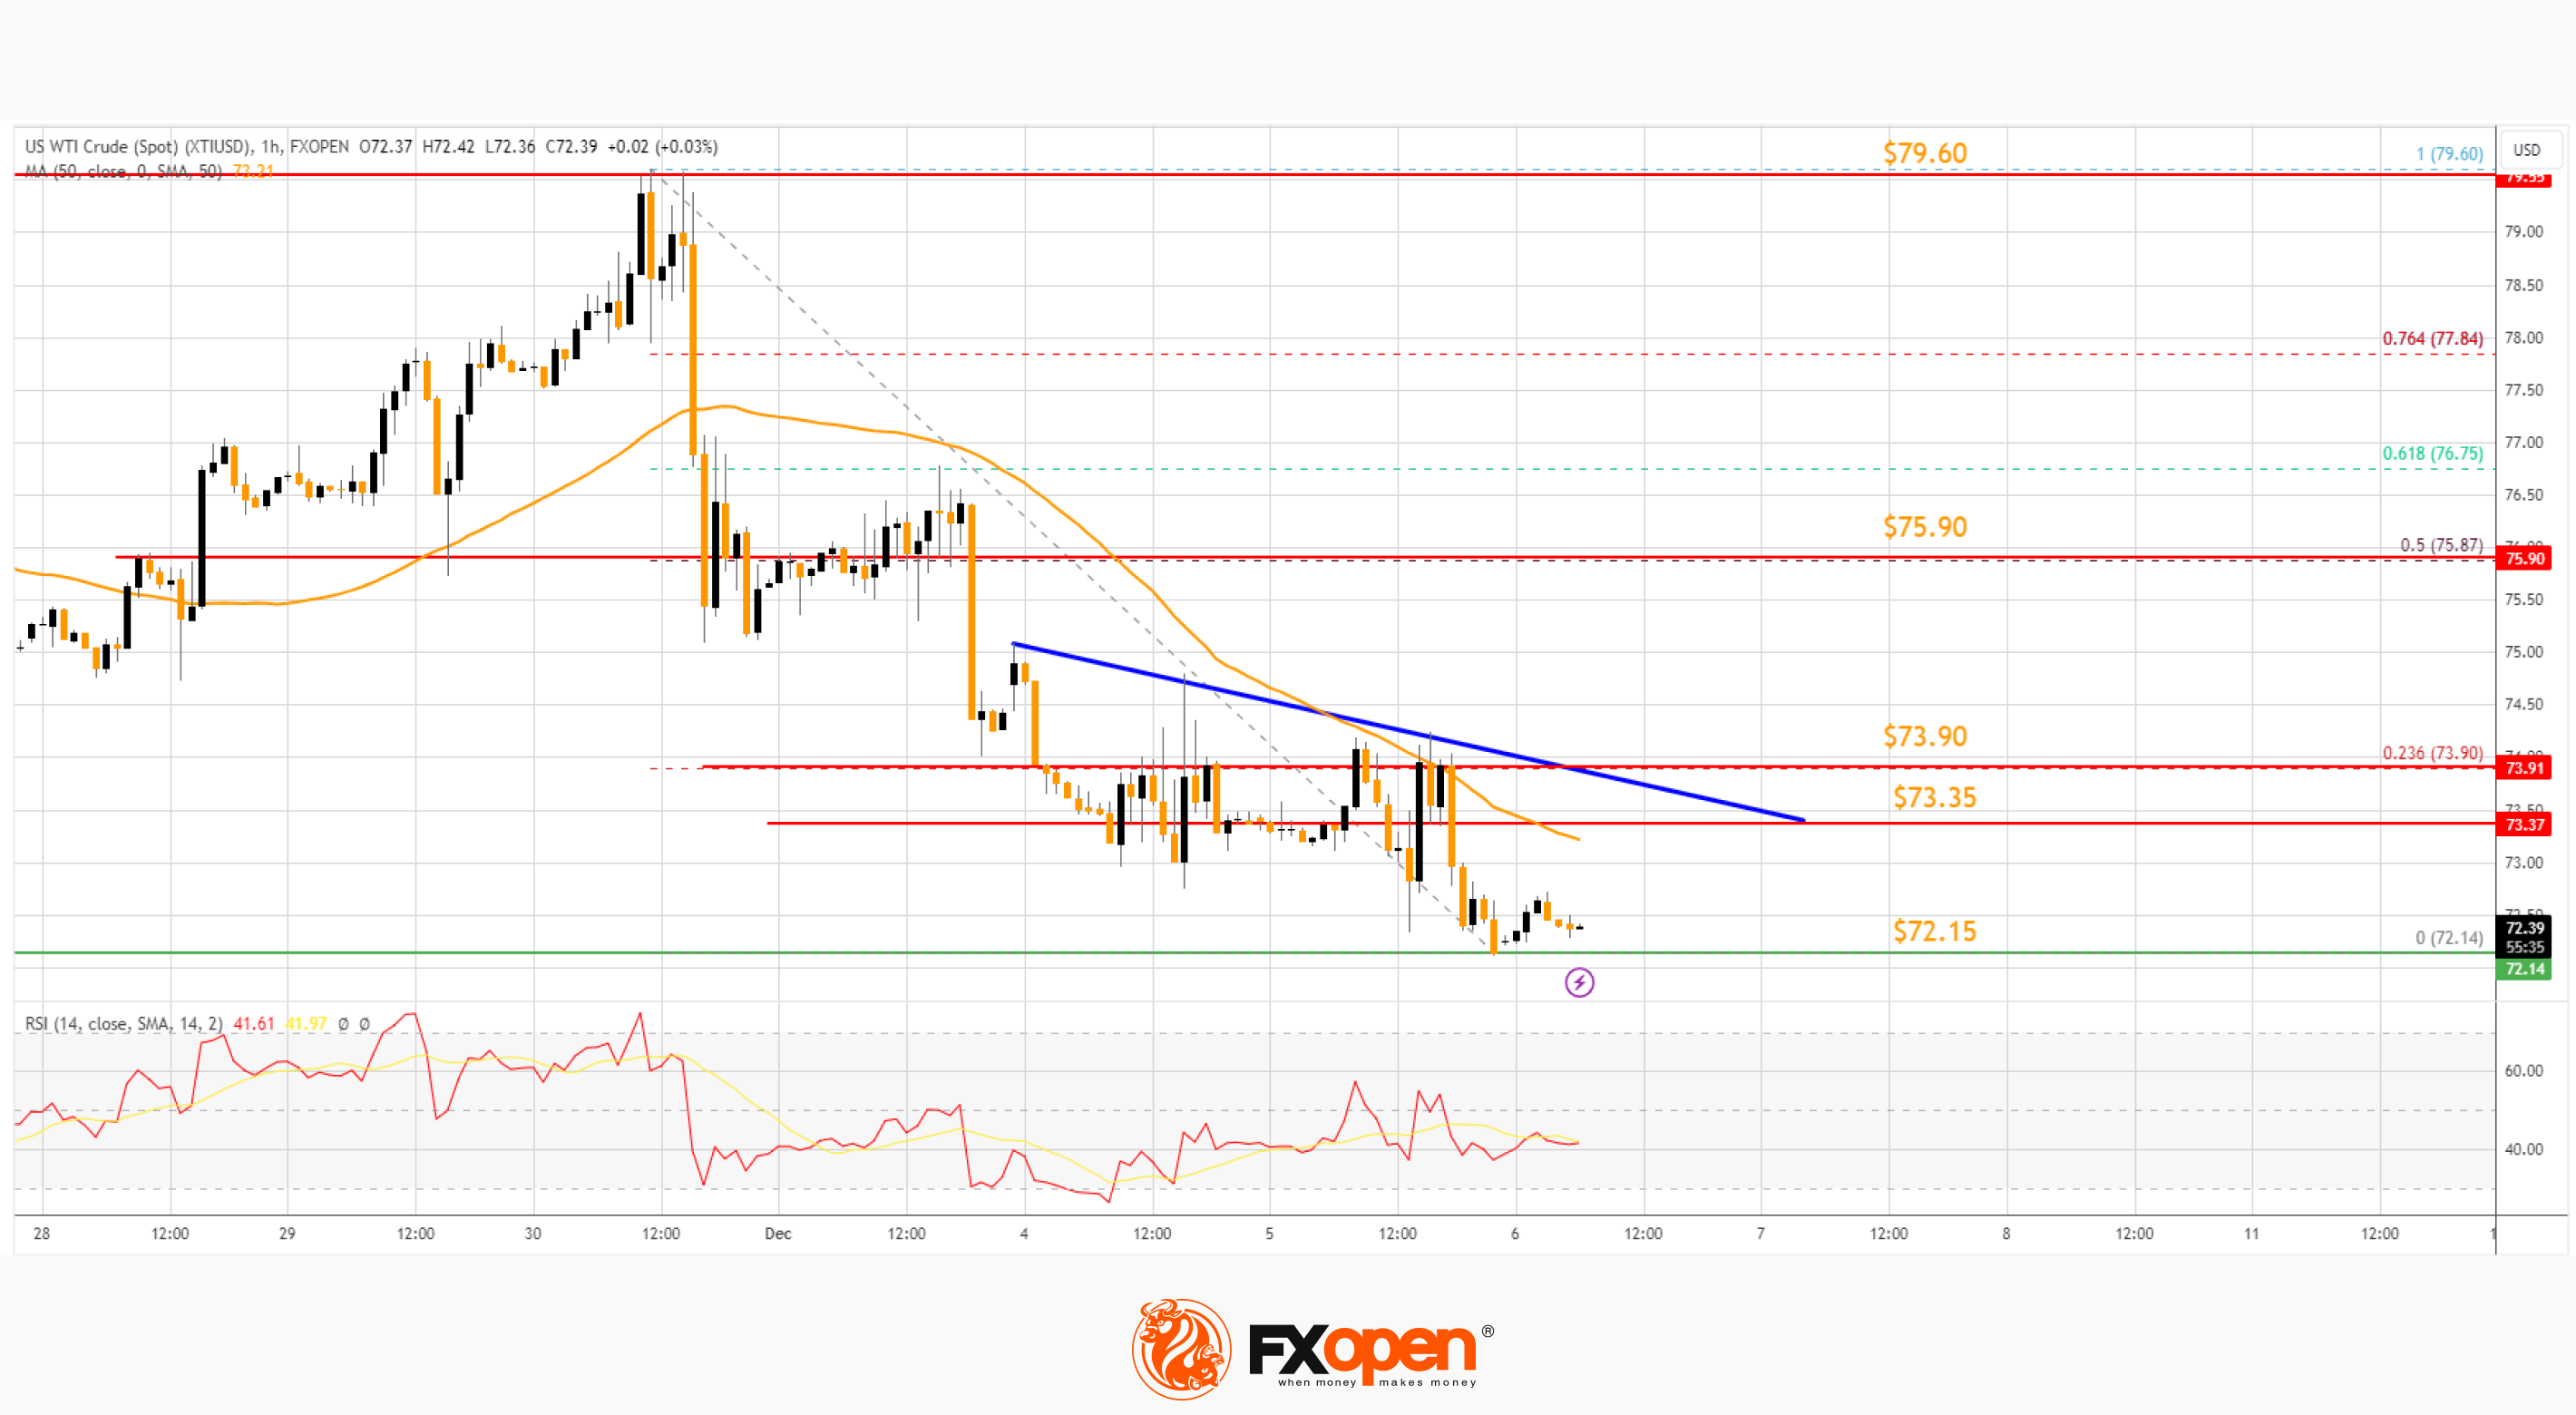
Immediate support is near the $72.15 level. The next major support on the WTI crude oil chart is near $71.50. If there is a downside break, the price might decline toward $70.00. Any more losses may perhaps open the doors for a move toward the $68.00 support zone.
On the upside, immediate resistance is near a major bearish trend line at $73.35. The next resistance is near the 23.6% Fib retracement level of the downward move from the $79.60 swing high to the $72.14 low at $73.90.
A clear move above the trend line resistance and $73.90 could send the price toward $75.90. It coincides with the 50% Fib retracement level of the downward move from the $79.60 swing high to the $72.14 low.
The next key resistance is near $79.60. If the price climbs further higher, it could face resistance near $80.00. Any more gains might send the price toward the $82.00 level.
Start trading commodity CFDs with tight spreads (additional fees may apply). Open your trading account now or learn more about trading commodity CFDs with FXOpen.
This article represents the opinion of the Companies operating under the FXOpen brand only. It is not to be construed as an offer, solicitation, or recommendation with respect to products and services provided by the Companies operating under the FXOpen brand, nor is it to be considered financial advice.
Stay ahead of the market!
Subscribe now to our mailing list and receive the latest market news and insights delivered directly to your inbox.


Latest articles

Oracle (ORCL) Shares Jump Above $160
Following a strong earnings report, Oracle shares surged above $160, marking roughly a 1.5-month high:
→ Earnings per share: expected $1.70, actual $1.79;
→ Revenue: expected $16.7bn, actual $17.2bn.
This is the first quarter in 15 years

USD/JPY Approaches Key Resistance Level
The USD/JPY chart shows a bullish trend at the start of March, influenced by the escalation of military activity in the Middle East.
On one hand, the US dollar is strengthening due to increased demand for safe-haven assets. On