


Market Analysis: Gold Sees Profit-Taking While WTI Crude Tests Key Support
FXOpen
Gold price started a downside correction from $5,115. WTI Crude oil is now attempting to recover after sliding toward $61.80.
Important Takeaways for Gold and WTI Crude Oil Prices Analysis Today
· Gold price climbed higher toward the $5,120 zone before there was a sharp decline against the US Dollar.
· A key bearish trend line is forming with resistance at $4,945 on the hourly chart of gold at FXOpen.
· WTI Crude oil prices extended losses below the $63.40 pivot zone.
· It dipped below a rising channel with support at $62.85 on the hourly chart of XTI/USD at FXOpen.
Gold Price Technical Analysis
On the hourly chart of Gold at FXOpen, the price climbed above $5,000. The price even spiked above $5,100 before the bears appeared.
A high was formed near $5,115 before there was a fresh decline. The last swing high was near $5,052 before the price settled below $5,000 and the 50-hour simple moving average. It tested the $4,850 zone.
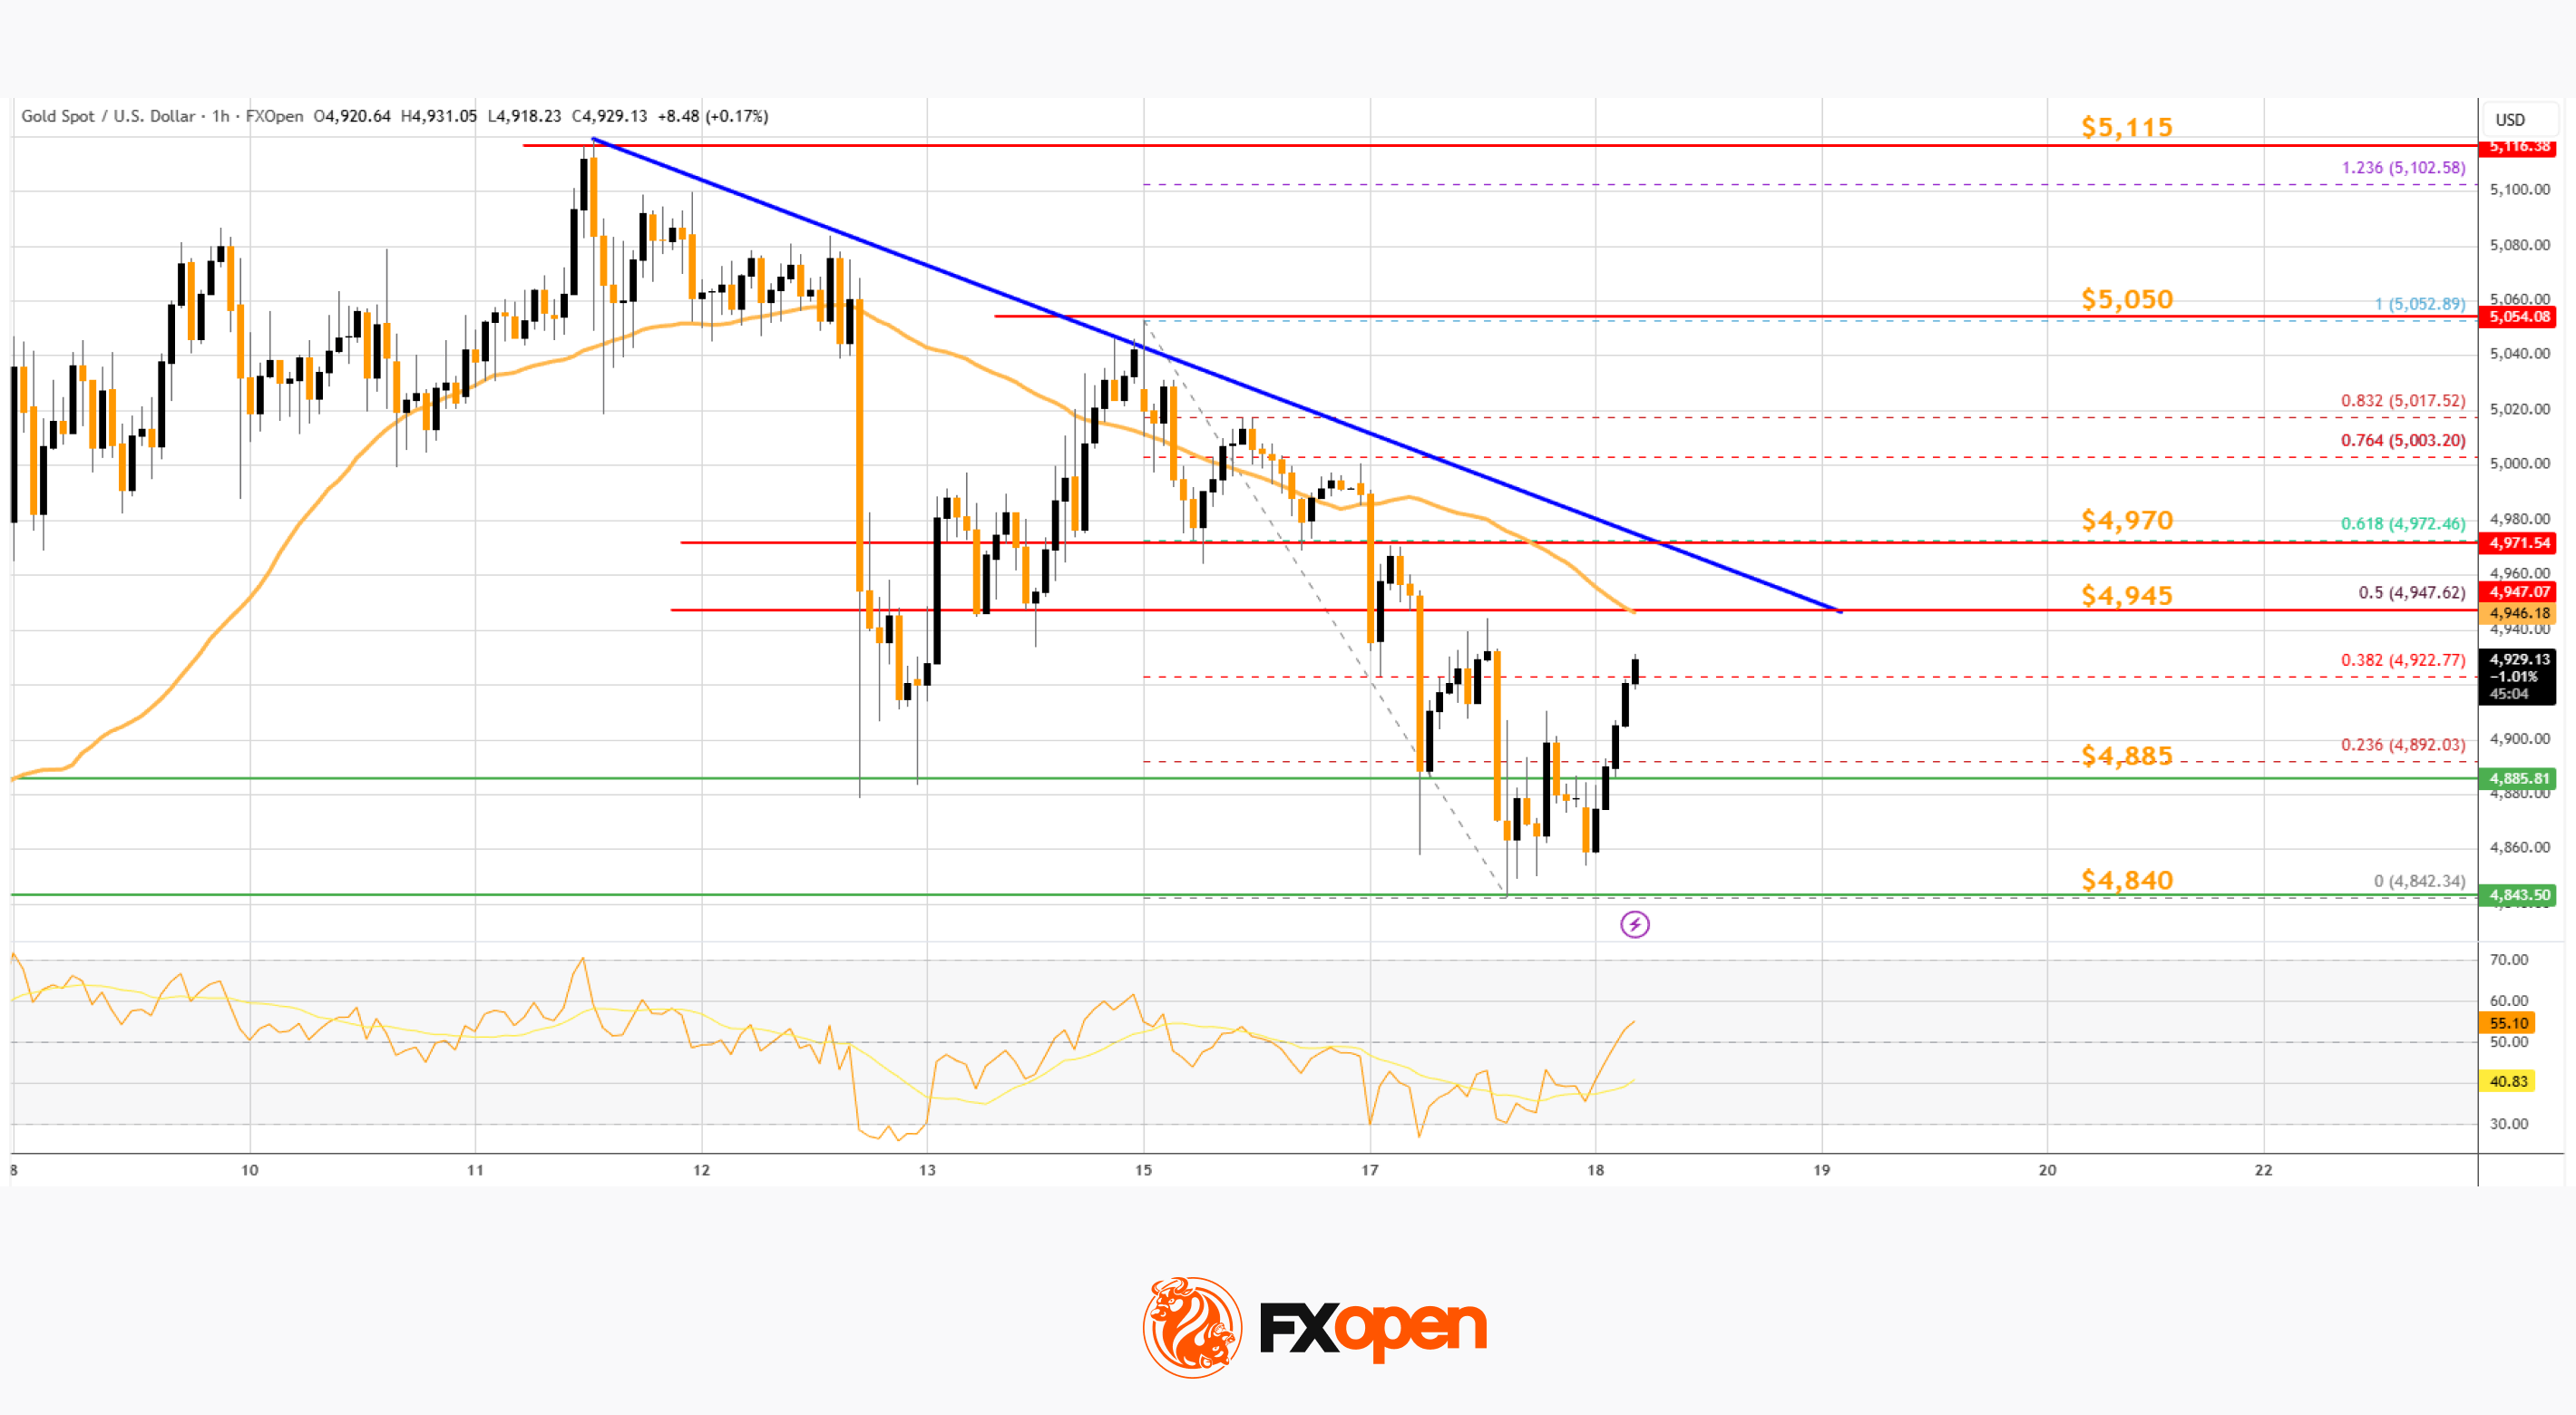
A low is formed near $4,842, and the price is now correcting losses. There was a minor move above the 23.6% Fib retracement level of the downward move from the $5,052 swing high to the $4,842 low.
Immediate barrier on the upside is $4,945, the 50-hour simple moving average, and the 50% Fib retracement. There is also a bearish trend line with resistance at $4,945. The first major hurdle for the bulls could be $4,970.
A close above $4,970 could send the price above $5,000. The next sell zone sits at $5,050, above which the price could test the $5,115 region. Any more gains might call for a move toward $5,200.
An upside break above $5,200 could send Gold price toward $5,285. Initial support on the downside is $4,885. The next key level is $4,840. If there is a downside break below $4,840, the price might decline further. In the stated case, the price might drop toward $4,750.
WTI Crude Oil Price Technical Analysis
On the hourly chart of WTI Crude Oil at FXOpen, the price struggled to continue higher above $65.00 against the US Dollar. The price formed a short-term top and started a fresh decline below $64.20.
There was a steady drop below the $63.40 pivot level. The bears even pushed the price below $62.50, a rising channel, and the 50-hour simple moving average. Finally, the price tested $61.80. The recent swing low was formed near $61.80, and the price is now correcting losses.
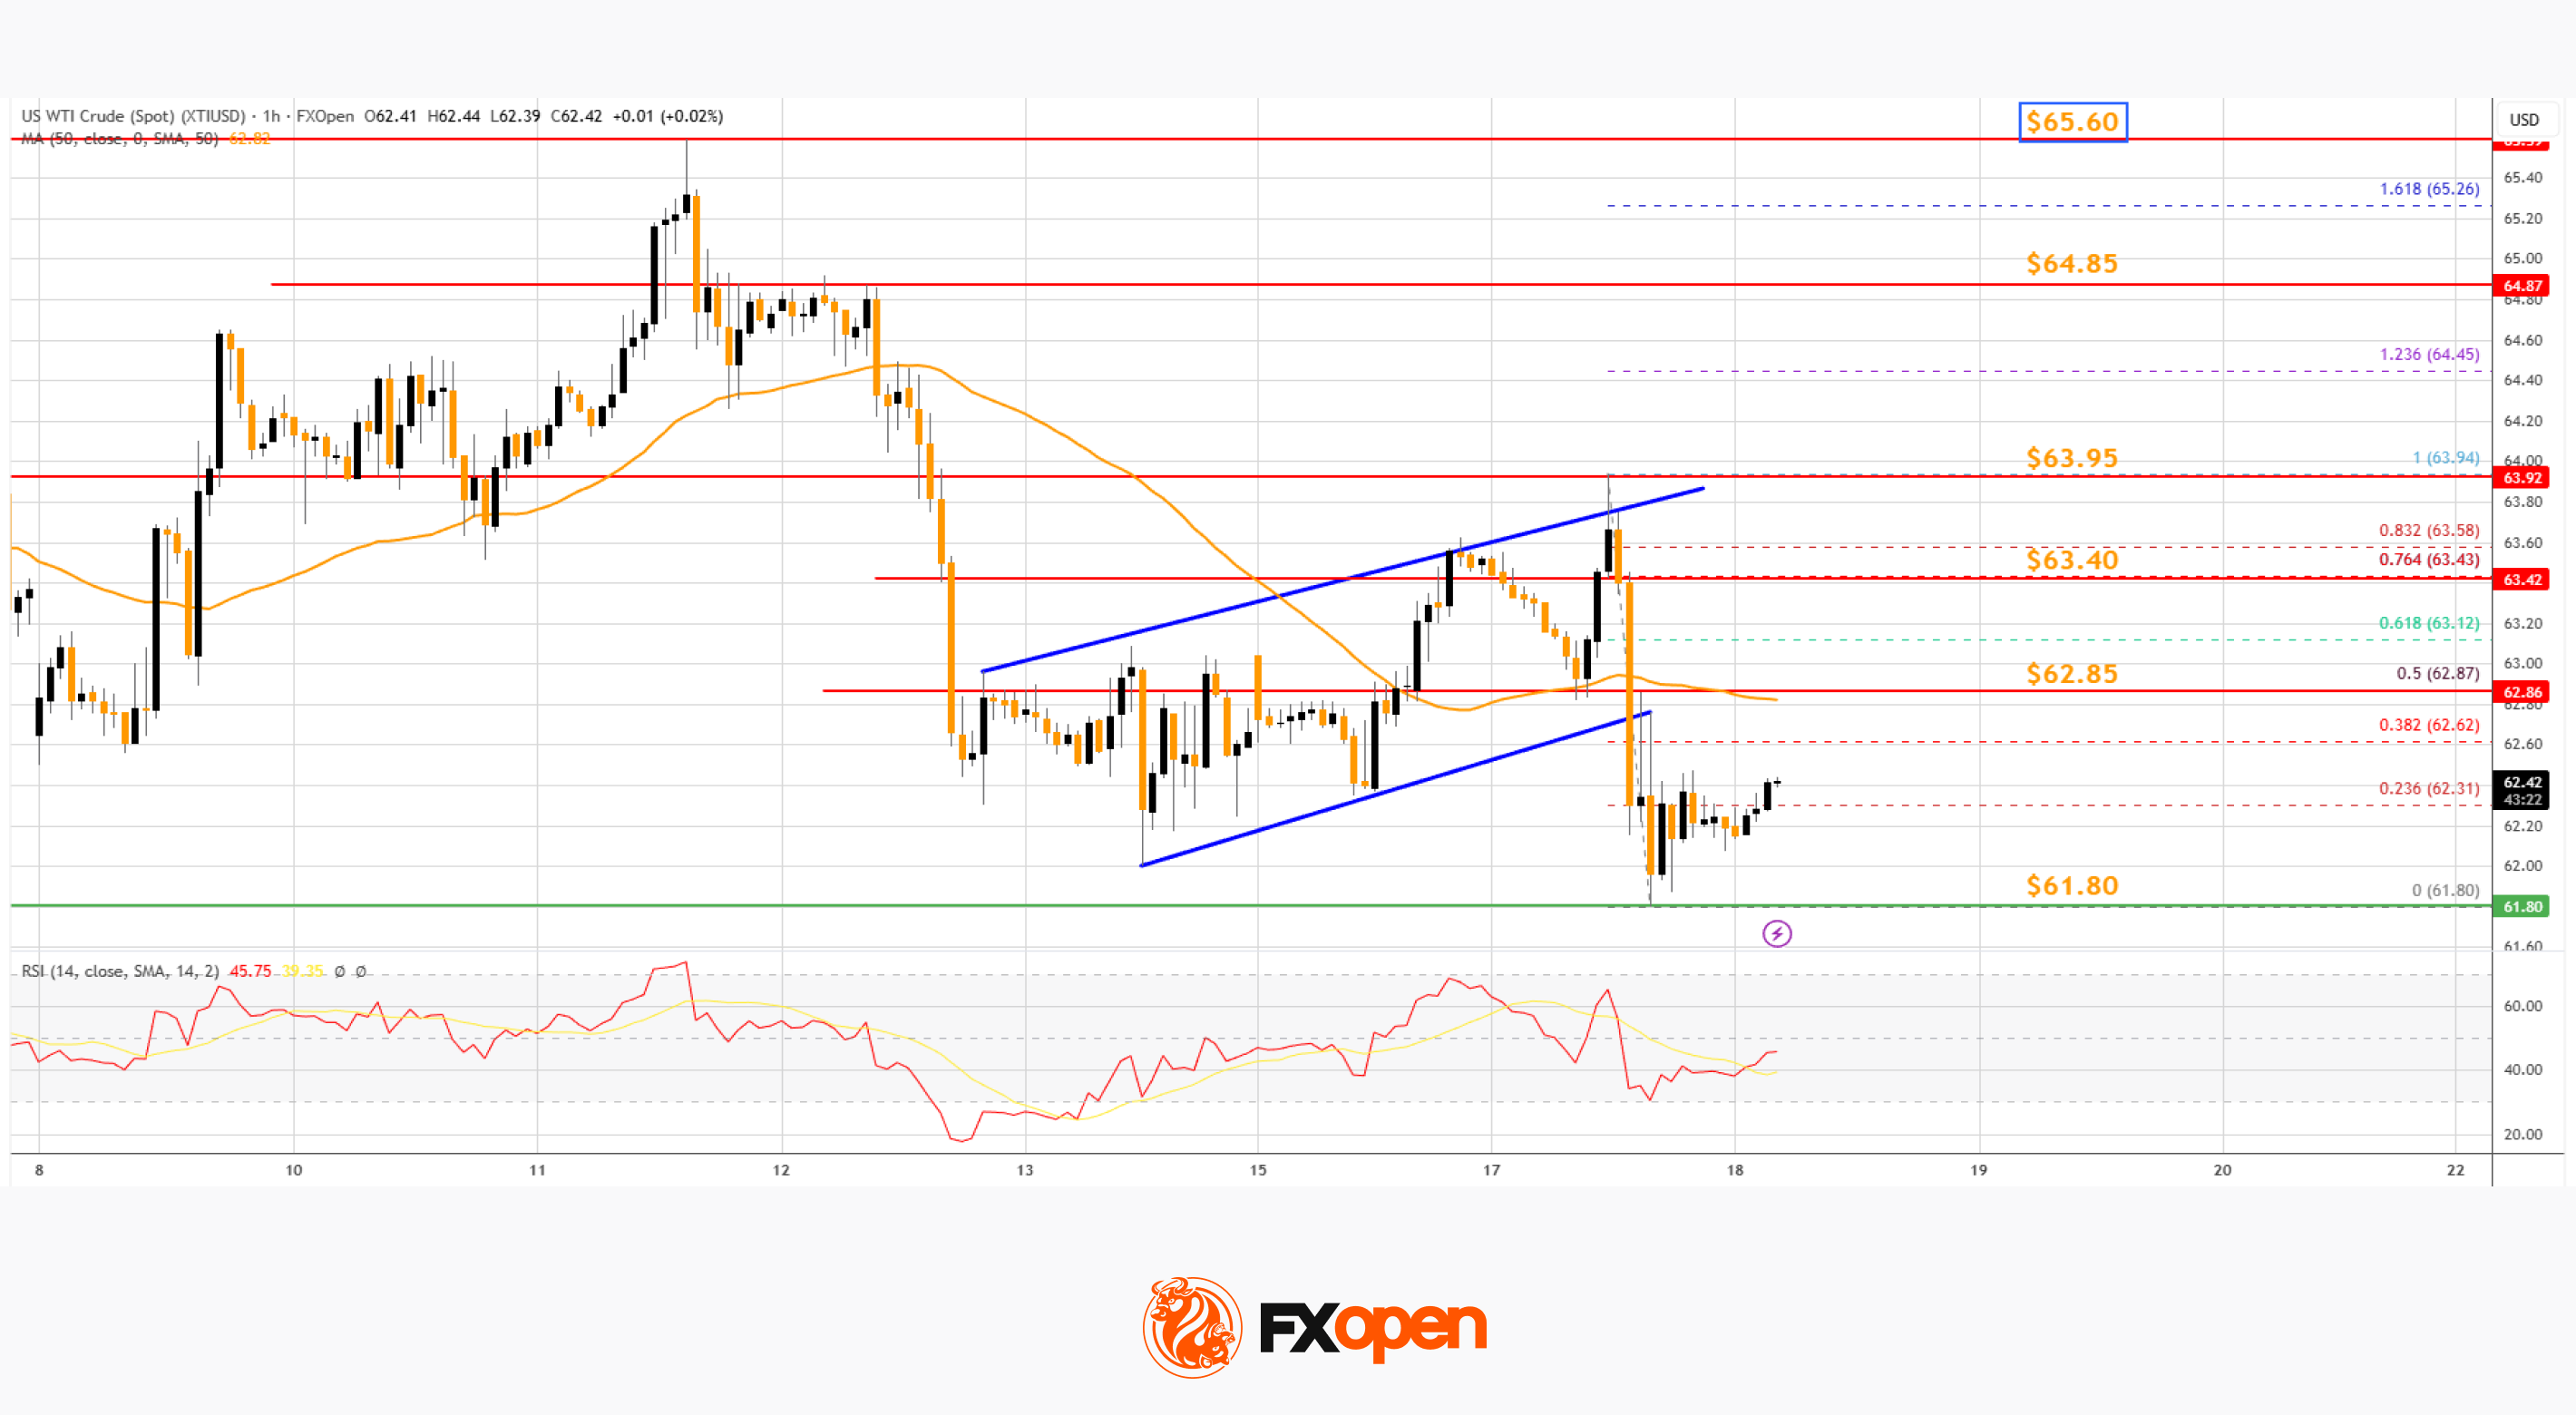
There was a move above the 23.6% Fib retracement level of the downward move from the $63.94 swing high to the $61.80 low. On the upside, immediate resistance is near the 50% Fib retracement at $62.85.
The main hurdle is $63.40. A clear move above $63.40 could send the price toward $63.95. The next stop for the bulls might be $64.85.
If the price climbs further, it could face sellers near $65.60. Immediate support is $61.80. The next major breakdown level on the WTI crude oil chartis $60.50. If there is a downside break, the price might decline toward $58.80. Any more losses may perhaps open the doors for a move toward $56.50.
Start trading commodity CFDs with tight spreads (additional fees may apply). Open your trading account now or learn more about trading commodity CFDs with FXOpen.
This article represents the opinion of the Companies operating under the FXOpen brand only. It is not to be construed as an offer, solicitation, or recommendation with respect to products and services provided by the Companies operating under the FXOpen brand, nor is it to be considered financial advice.
Stay ahead of the market!
Subscribe now to our mailing list and receive the latest market news and insights delivered directly to your inbox.


Latest articles

NVIDIA: Kyber NVL144 Dispute Weighs on the Stock
NVIDIA shares found themselves at the centre of debate over the future of the Kyber NVL144 system. On 6 July, CNBC, citing research firm SemiAnalysis, reported that the project could be delayed by more than a year—from 2027 to
EUR/GBP: Trendline Support or Breakdown to New Lows?
EUR/GBP has slid to its weakest level in a year, as the two currencies continue to follow increasingly divergent paths. The ECB's June hike—its first since 2023—was meant to signal renewed hawkishness, but the very next inflation
USD/CAD: One Trendline Away From Deciding the Next Move
After several strongly positive weeks, USD/CAD has stalled over the past few sessions, entering a phase of uncertainty.
On the dollar side, Fed Chair Kevin Warsh has struck a firm tone, reaffirming the 2% inflation target and pushing back