


AUD/CAD: Pair Remains Range-Bound Amid Interest Rate Divergence
FXOpen

The key macroeconomic factor for AUD/CAD remains the divergence in monetary policy between the two central banks. After three consecutive rate hikes since the beginning of the year, the Reserve Bank of Australia left its cash rate unchanged at 4.35%, citing persistent inflationary pressure and signs of slowing economic growth. The RBA stressed that inflation remains above its target range and that it is in no rush to begin easing policy. By contrast, the Bank of Canada has now kept its policy rate unchanged at 2.25% for a fifth consecutive meeting. Economic activity remains subdued, inflation has risen mainly due to higher energy prices, while core inflation has eased to 2.1%. The 210-basis-point interest rate differential formally supports the Australian dollar, although the RBA's more restrictive policy cycle continues to weigh on domestic demand and limits further gains in AUD.
Technical Picture
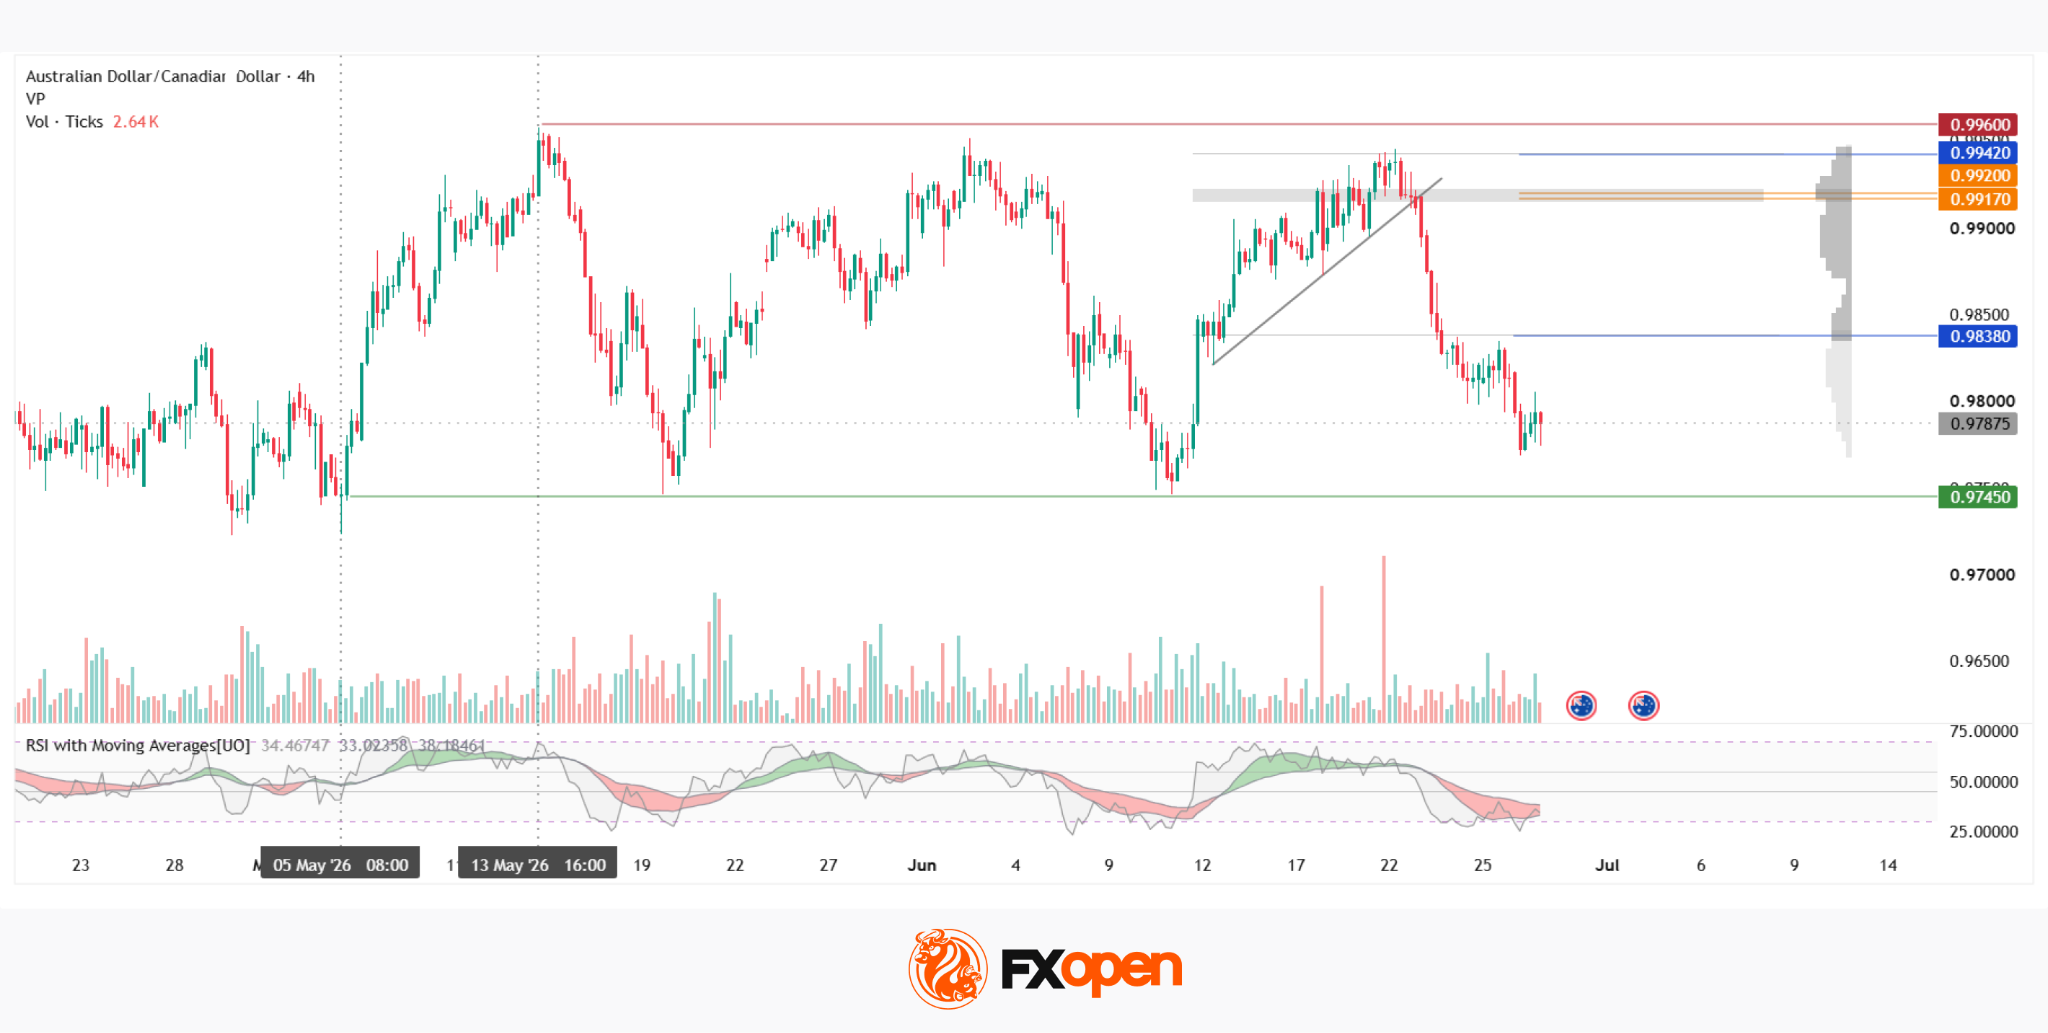
On the four-hour chart, AUD/CAD continues to trade within a broad sideways range, bounded by green support near 0.9745 and red resistance around 0.9960. During the first half of June, a local bullish trend developed within the range; however, in the latter part of the month, the price broke below the trendline and fell beneath the lower boundary of the current market profile at 0.9838. The POC zone is concentrated between 0.9917 and 0.9920 and could act as resistance should the market reverse higher.
Given the close proximity of the POC zone, the upper boundary of the profile at 0.9942, and the resistance level itself, this cluster may attract increased selling interest. Current horizontal volume remains moderate, suggesting the absence of a clear market bias. RSI + MAs shows readings of 34, 33, 38. The RSI has already entered oversold territory, while the moving averages, although coloured red, remain broadly horizontal.
Key Takeaways
The pair continues to trade within its established range, lacking a catalyst for a decisive breakout. The RSI has moved out of oversold territory, while the moving averages, although still red, have lost their directional bias. Further price action will largely depend on how the market reassesses expectations for the RBA's policy path amid signs of slowing growth in the Australian economy.
Trade over 50 forex markets 24 hours a day with FXOpen. Take advantage of low commissions, deep liquidity, and spreads from 0.0 pips (additional fees may apply). Open your FXOpen account now or learn more about trading forex with FXOpen.
This article represents the opinion of the Companies operating under the FXOpen brand only. It is not to be construed as an offer, solicitation, or recommendation with respect to products and services provided by the Companies operating under the FXOpen brand, nor is it to be considered financial advice.
Stay ahead of the market!
Subscribe now to our mailing list and receive the latest market news and insights delivered directly to your inbox.


Latest articles

CAD/JPY: The Yen's Most Historic Move in 30 Years Meets a Fragile Support
Two central banks are heading in genuinely opposite directions this week, and the tension is unmistakable. The Bank of Canada held rates steady at 2.25% on September 2, with a mildly hawkish tilt as policymakers acknowledged a broadening economic

USD/JPY and USD/CAD Await Key Fed Decision
The US dollar is consolidating against the yen and Canadian dollar ahead of the key event of the week — the Federal Reserve meeting. The Fed is widely expected to raise its policy rate by 25 basis points to a range

UnitedHealth: Fundamentals Are Healing, Now the Chart Must Agree
UnitedHealth finds itself in a genuinely split narrative right now, trading near $388, down about 15.9% from its 52-week high, even as the fundamental picture keeps improving. Q2 earnings beat expectations, with revenue of $112.03 billion, and the