


Bank of America: Strong Earnings Reignite Buying Interest
FXOpen

On 15 April 2026, Bank of America reported its Q1 2026 financial results, exceeding analysts’ consensus estimates for both profit and revenue. Net income came in at $8.6 billion (+17% year-on-year), while revenue reached $30.3 billion (+7% YoY). Earnings per share stood at $1.11 versus a forecast of $1.01 — the highest EPS level in nearly two decades.
Growth was primarily driven by net interest income ($15.7 billion, +9%), alongside gains in trading, investment banking fees, and asset management. Equity trading revenue rose by 30% to $2.83 billion, beating expectations by roughly $350 million.
Technical Outlook
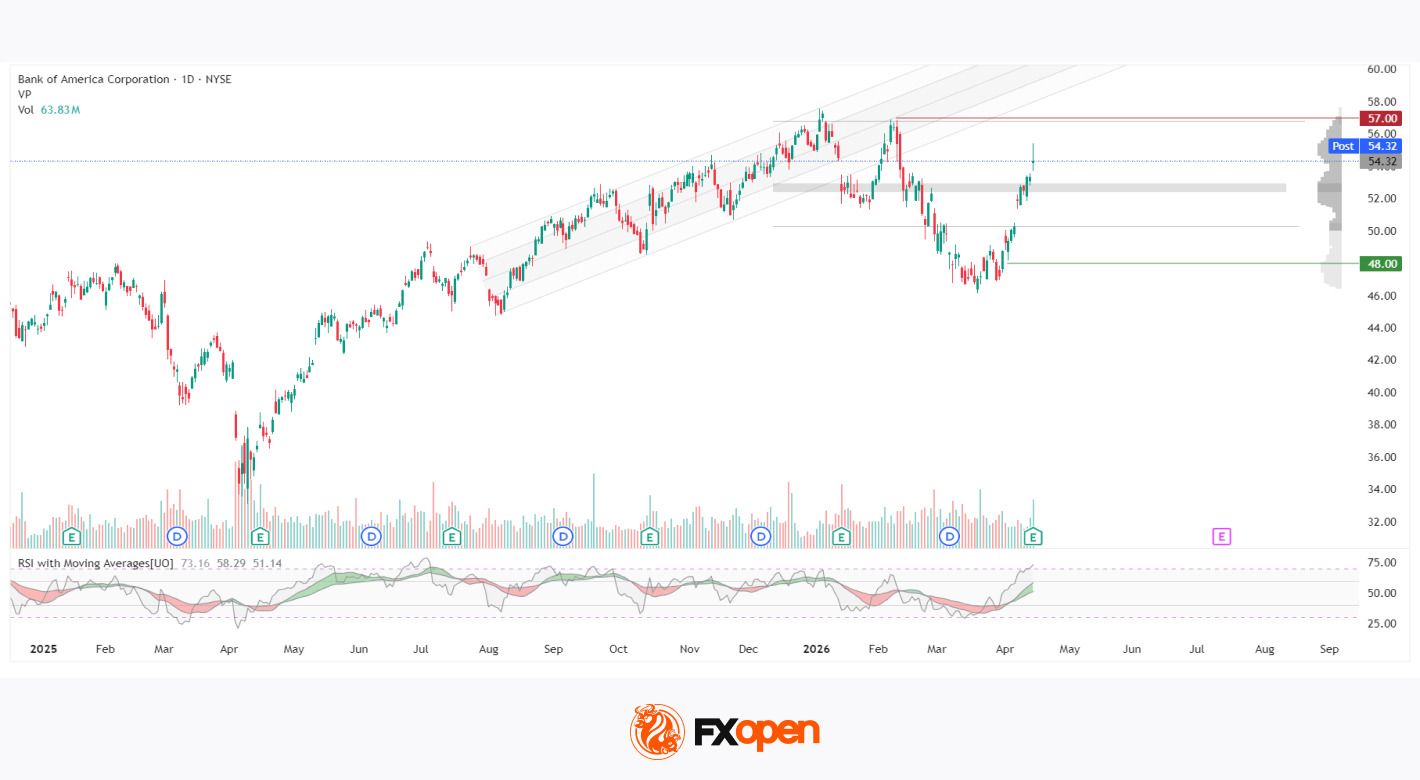
On the daily timeframe, the earnings release appears to have triggered a strong wave of buying within a high-density horizontal volume zone. The price is currently attempting to extend gains following a breakout above the Point of Control (POC) at 52.50–53.00, with the next potential target near 57.00, which aligns with the upper boundary of the volume range.
Above current levels, the market profile shows a notable decline in trading volume. If price manages to hold above the POC, this could potentially create conditions for an acceleration towards the 57.00 resistance area.
The RSI, currently at 73, is in overbought territory but remains above its moving averages, which may confirm the strength of the ongoing bullish impulse. At the same time, the rapid rise in the RSI with Moving Averages could increase the risk of a corrective pullback if buyers fail to maintain prices above the POC in upcoming sessions. The 48 level may serve as the lower boundary of the current market structure.
Summary
The stock appears to be attempting a breakout from a horizontal volume range, supported by a strong fundamental catalyst. The 48 and 57 levels define the current structure, while further price action is likely to depend on whether buyers can sustain a move above the 52.50–53.00 POC zone, which could then act as support.
upport.
Buy and sell stocks of the world's biggest publicly-listed companies with CFDs on FXOpen’s trading platform. Open your FXOpen account now or learn more about trading share CFDs with FXOpen.
This article represents the opinion of the Companies operating under the FXOpen brand only. It is not to be construed as an offer, solicitation, or recommendation with respect to products and services provided by the Companies operating under the FXOpen brand, nor is it to be considered financial advice.
Stay ahead of the market!
Subscribe now to our mailing list and receive the latest market news and insights delivered directly to your inbox.


Latest articles

Nasdaq 100: Is This the Correction Traders Have Been Waiting For?
The Nasdaq 100 (US Tech 100 Mini on FXOpen) remains caught between two opposing forces: cooling inflation on one side, and persistent geopolitical instability on the other. On 14 July, June's CPI print came in softer than expected, easing near-term

XRP/USD: Symmetrical Triangle Forms as Trading Volume Fades
On 6 July, Ripple received a full Crypto-Asset Service Provider (CASP) licence under the Markets in Crypto-Assets (MiCA) regulation from Luxembourg's financial regulator, the CSSF. The approval allows the company to offer regulated crypto payment services across all 30 countries

AI Valuations Are Back in the Spotlight
Artificial intelligence remains the dominant investment theme of 2026, but investors are increasingly questioning whether AI stock valuations are keeping pace with reality.
💰 Big Tech continues to invest at an unprecedented scale, with hyperscaler AI spending projected to exceed $800