


Tesla: Complex Range Structure Breaks Down Following Quarterly Earnings
FXOpen

Tesla released its Q2 2026 results after the market closed on 22 July. Revenue increased 26% year-on-year to $28.24 billion, while vehicle deliveries reached a record 480,126 units. However, operating margin fell sharply to 1.4%, down from 4.1% a year earlier, and operating income declined 57% to $398 million. Adjusted earnings per share came in at $0.33, missing analysts' consensus estimates. Free cash flow also turned negative as capital expenditure surged, driven by investment in AI, Robotaxi, and Optimus projects.
Technical Analysis
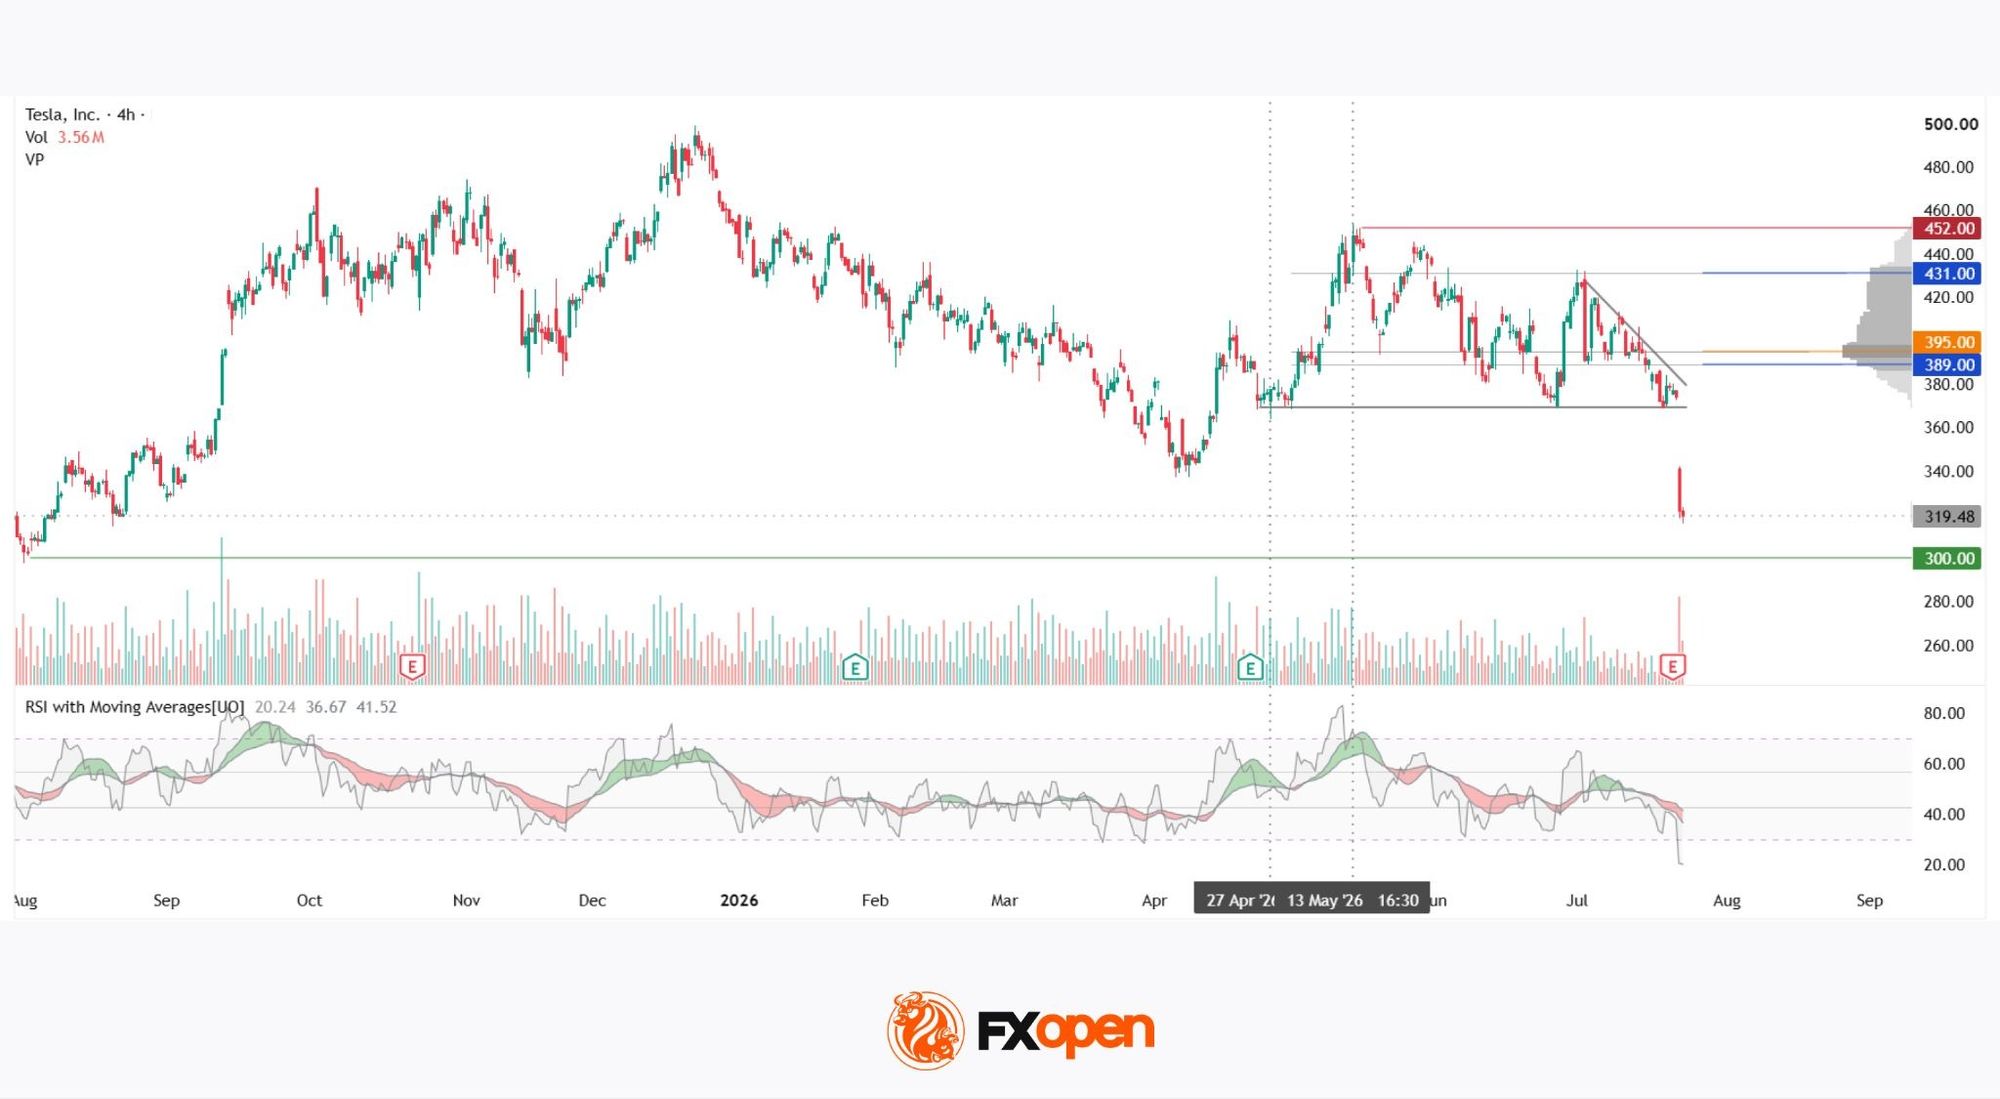
On the 4-hour chart of TSLA, the price has formed a complex sideways trading structure following this year's short-term uptrend. On 23 July, the market reacted sharply to the earnings release, with the stock opening significantly lower in a high-volume gap down, breaking below the lower boundary of the current trading range. The price is now moving lower towards the important $300 support level.
The chart also shows that the price has fallen below the current market profile, which consists of the following levels: the lower boundary at $389, the Point of Control (POC) at $395, and the upper boundary at $431. These levels could attract renewed market interest should the trend reverse. Above the profile, resistance is located at $452, which could become the next significant barrier if the price recovers above the profile.
The RSI + MAs indicator currently shows readings of 20, 36, and 41. The gap between the moving averages remains significant, the averages are coloured red and have moved out of the uncertainty zone, indicating persistent bearish momentum. At the same time, the RSI has entered oversold territory.
Key Takeaways
Tesla's quarterly results highlighted a sharp contrast between record revenue and a significant deterioration in profitability, shifting investors' focus from sales growth to weakening margins. From a technical perspective, the stock has broken below its established trading range, while the RSI remains in oversold territory without yet showing clear signs of a reversal.
Buy and sell stocks of the world's biggest publicly-listed companies with CFDs on FXOpen’s trading platform. Open your FXOpen account now or learn more about trading share CFDs with FXOpen.
This article represents the opinion of the Companies operating under the FXOpen brand only. It is not to be construed as an offer, solicitation, or recommendation with respect to products and services provided by the Companies operating under the FXOpen brand, nor is it to be considered financial advice.
Stay ahead of the market!
Subscribe now to our mailing list and receive the latest market news and insights delivered directly to your inbox.


Latest articles

CAD/JPY: The Yen's Most Historic Move in 30 Years Meets a Fragile Support
Two central banks are heading in genuinely opposite directions this week, and the tension is unmistakable. The Bank of Canada held rates steady at 2.25% on September 2, with a mildly hawkish tilt as policymakers acknowledged a broadening economic

USD/JPY and USD/CAD Await Key Fed Decision
The US dollar is consolidating against the yen and Canadian dollar ahead of the key event of the week — the Federal Reserve meeting. The Fed is widely expected to raise its policy rate by 25 basis points to a range

UnitedHealth: Fundamentals Are Healing, Now the Chart Must Agree
UnitedHealth finds itself in a genuinely split narrative right now, trading near $388, down about 15.9% from its 52-week high, even as the fundamental picture keeps improving. Q2 earnings beat expectations, with revenue of $112.03 billion, and the