


Alphabet: Five Months of Consolidation Reach Their Breaking Point
FXOpen

Alphabet just had a genuinely turbulent month, and the whiplash tells its own story. Despite beating earnings expectations with profits of $9.11 per share, roughly triple what analysts had forecast, the stock actually sold off in the days following the report, weighed down by mounting concerns over AI spending. That mood shifted decisively on Monday, when shares jumped over 5% after Morgan Stanley reassured investors, highlighting Alphabet's still-robust $53.3 billion in free cash flow over the past twelve months, even as cloud capital expenditure could exceed $1.2 trillion in 2027.
The underlying business remains genuinely strong: Google Cloud revenue surged 82% year-over-year to $24.8 billion in Q2, and the company has been actively defending its position, launching more budget-friendly AI pricing to compete directly with rivals. That said, not everything has gone smoothly. Alphabet agreed to pay £260 million to settle a UK class-action lawsuit this week, and a leadership shakeup within its AI division, including the departure of key figures, has added a layer of organizational uncertainty investors are still digesting.
The result: a company delivering genuinely impressive growth, but one whose massive AI bet keeps testing investors' patience with every headline.
Technical Analysis of Alphabet (GOOGL)
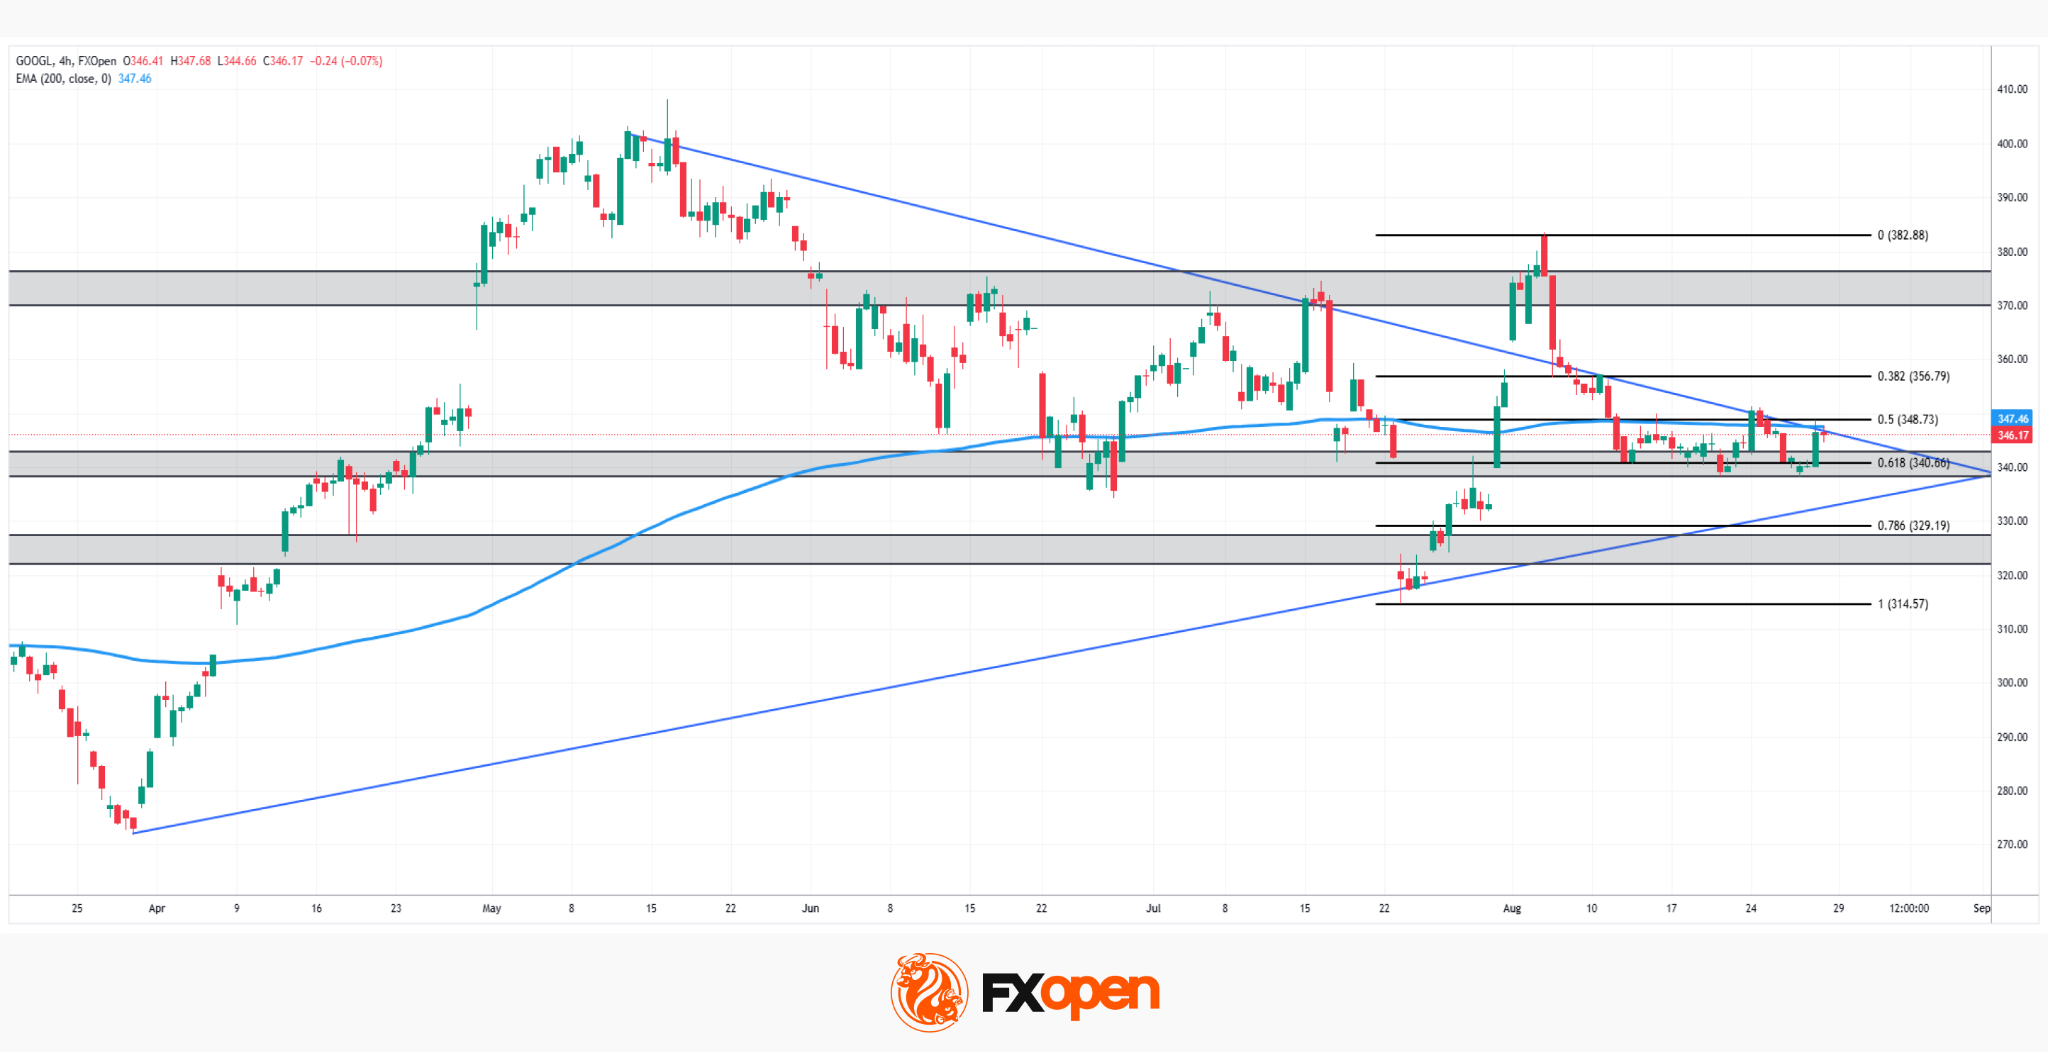
As the GOOGL chart shows, the stock has been compressing into a symmetrical triangle since April, with a descending trendline from the 400 highs converging with an ascending trendline off the 269 low, both meeting right at the current price near 340–346, exactly where the 0.5 Fibonacci retracement and the 200-period EMA also sit.
Bullish Scenario
Should buyers defend this trendline-EMA confluence and break decisively above the descending trendline, the path would open toward the 0.382 retracement near 356.79, with a stronger move potentially targeting the 0 level at 382.88, the origin of the entire pullback.
Bearish Scenario
Conversely, a break below the ascending trendline and the 0.618 retracement near 340.66 would expose the 0.786 level near 329.19, with a deeper slide risking a retest of the 314.57 low that anchored this five-month structure.
With price coiled right at the apex of this triangle, sitting exactly on the 200-period EMA, Alphabet's next move looks set to be decisive. Will the AI spending story finally translate into a genuine breakout, or does the stock settle back into its earlier range?
Buy and sell stocks of the world's biggest publicly-listed companies with CFDs on FXOpen’s trading platform. Open your FXOpen account now or learn more about trading share CFDs with FXOpen.
This article represents the opinion of the Companies operating under the FXOpen brand only. It is not to be construed as an offer, solicitation, or recommendation with respect to products and services provided by the Companies operating under the FXOpen brand, nor is it to be considered financial advice.
Stay ahead of the market!
Subscribe now to our mailing list and receive the latest market news and insights delivered directly to your inbox.


Latest articles

CAD/JPY: The Yen's Most Historic Move in 30 Years Meets a Fragile Support
Two central banks are heading in genuinely opposite directions this week, and the tension is unmistakable. The Bank of Canada held rates steady at 2.25% on September 2, with a mildly hawkish tilt as policymakers acknowledged a broadening economic

USD/JPY and USD/CAD Await Key Fed Decision
The US dollar is consolidating against the yen and Canadian dollar ahead of the key event of the week — the Federal Reserve meeting. The Fed is widely expected to raise its policy rate by 25 basis points to a range

UnitedHealth: Fundamentals Are Healing, Now the Chart Must Agree
UnitedHealth finds itself in a genuinely split narrative right now, trading near $388, down about 15.9% from its 52-week high, even as the fundamental picture keeps improving. Q2 earnings beat expectations, with revenue of $112.03 billion, and the