


AUD/NZD: Fresh Hikes on Both Sides, One Chart Still Undecided
FXOpen

The Aussie enters this week with genuine hawkish backing after Australia's Q2 GDP surprised sharply to the upside, pushing the market-implied probability of a September RBA hike from 48% to 57%, with a November move now more than fully priced. Governor Bullock's board has already flagged upside inflation risks tied to Middle East-driven energy costs, and rising Australian bond yields, which touched their highest level since April 2011 this week, are only reinforcing that hawkish backdrop.
Across the Tasman, the RBNZ delivered exactly what all five major New Zealand bank economists expected on Wednesday: a 25bp hike to 2.75%, the second consecutive increase after July's tightening move. Headline inflation remains elevated at 4.1%, though the central bank's own projections signal a likely pause in October before potentially resuming in December, leaving markets pricing roughly a 30% chance of another hike this year.
The result: two central banks now both firmly in tightening mode, though the RBA's path still carries more near-term uncertainty than the RBNZ's, whose next move already looks broadly telegraphed through year-end.
Technical Analysis of AUD/NZD
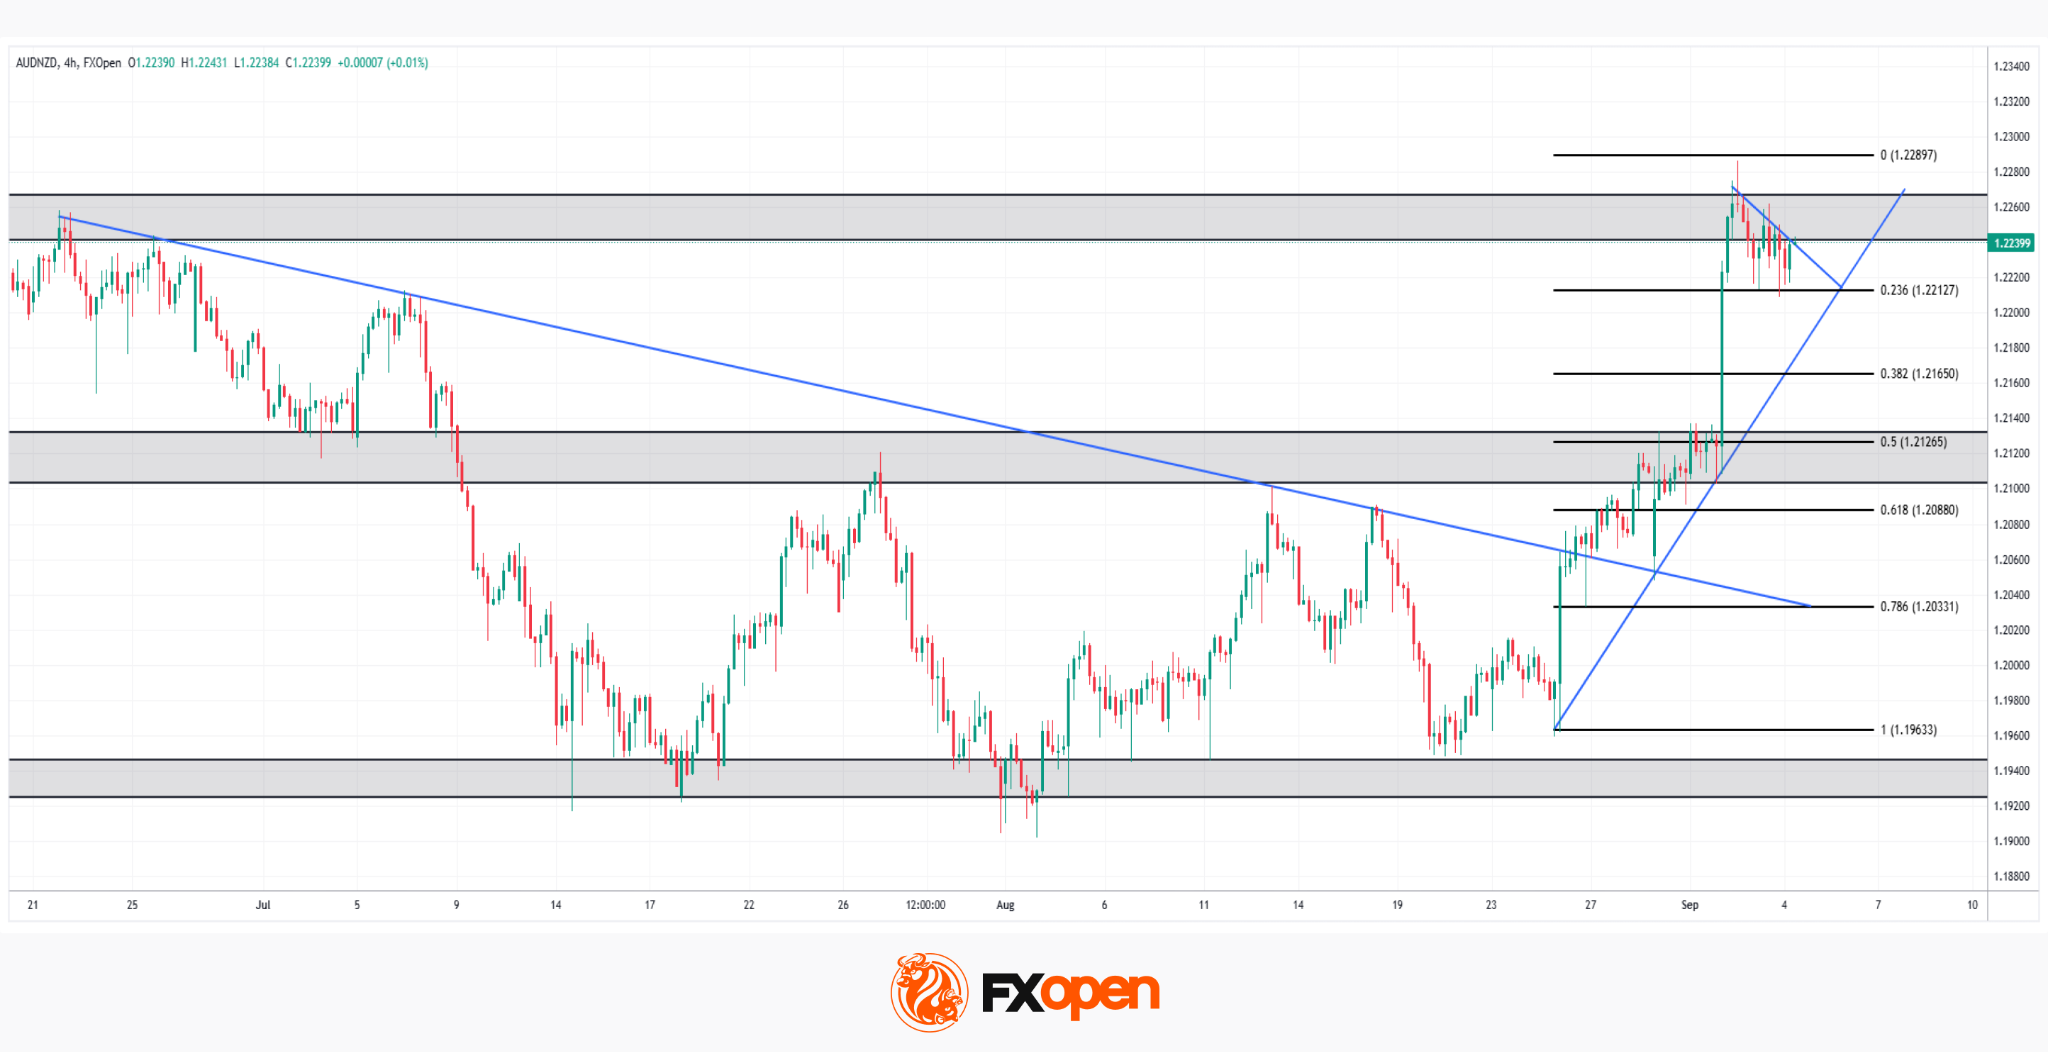
As the AUD/NZD chart shows, the pair staged a sharp rally from the 1.19633 low, riding a steep ascending trendline that has powered the entire late-August advance. That rally has since run into resistance near the 1.22897 high, the 0 Fibonacci level, where price is now consolidating just above the 0.236 retracement near 1.22127, caught between a shorter-term descending trendline from this week's peak and the broader medium-term descending trendline that has capped the pair since late June.
Bullish Scenario
Should buyers defend the 0.236 retracement and the ascending trendline while breaking above the short-term descending trendline, the path would open towards a retest of the 1.22897 high. A confirmed break above that level would mark a genuine shift in the broader multi-month structure.
Bearish Scenario
Conversely, a break below the 0.236 level and the steep ascending trendline would expose the intermediate 1.213–1.215 support zone, coinciding with the 0.5 Fibonacci retracement. A deeper slide below that zone would risk a fuller retracement of the late-August rally, back towards the 0.618–0.786 area near 1.203–1.209.
With price squeezed between a reclaimed short-term trendline, a defended ascending trendline, and the long-term descending trendline, AUD/NZD looks poised for a decisive move. Will the RBA's hawkish momentum push the pair through resistance, or will the broader downtrend since June reassert control?
Trade over 50 forex markets 24 hours a day with FXOpen. Take advantage of low commissions, deep liquidity, and spreads from 0.0 pips (additional fees may apply). Open your FXOpen account now or learn more about trading forex with FXOpen.
This article represents the opinion of the Companies operating under the FXOpen brand only. It is not to be construed as an offer, solicitation, or recommendation with respect to products and services provided by the Companies operating under the FXOpen brand, nor is it to be considered financial advice.
Stay ahead of the market!
Subscribe now to our mailing list and receive the latest market news and insights delivered directly to your inbox.


Latest articles

CAD/JPY: The Yen's Most Historic Move in 30 Years Meets a Fragile Support
Two central banks are heading in genuinely opposite directions this week, and the tension is unmistakable. The Bank of Canada held rates steady at 2.25% on September 2, with a mildly hawkish tilt as policymakers acknowledged a broadening economic

USD/JPY and USD/CAD Await Key Fed Decision
The US dollar is consolidating against the yen and Canadian dollar ahead of the key event of the week — the Federal Reserve meeting. The Fed is widely expected to raise its policy rate by 25 basis points to a range

UnitedHealth: Fundamentals Are Healing, Now the Chart Must Agree
UnitedHealth finds itself in a genuinely split narrative right now, trading near $388, down about 15.9% from its 52-week high, even as the fundamental picture keeps improving. Q2 earnings beat expectations, with revenue of $112.03 billion, and the