


Gold Analysis: Could XAU/USD Bounce From the Crucial $4,000 Level?
FXOpen

The year 2026 has so far been an unforgiving one for gold. XAU/USD is down approximately 7% since the start of the year, and roughly 28% from the late-January peak — a significant correction, though a physiologically natural one following the sustained bullish rally of recent years.
Fundamental Picture
Several factors have converged to weigh on the precious metal. The Federal Reserve has maintained its restrictive stance, keeping interest rates elevated and reducing the appeal of a non-yielding asset like gold. Simultaneously, institutional portfolio rotation has forced financial players to liquidate a portion of the long positions accumulated during the bull run, amplifying selling pressure. Notably, even the US-Iran geopolitical tension — a scenario that would typically act as a tailwind for gold in its role as a so-called safe-haven asset — has failed to provide meaningful support, with the broader macro environment overriding the flight-to-safety narrative.
Technical Analysis of XAU/USD
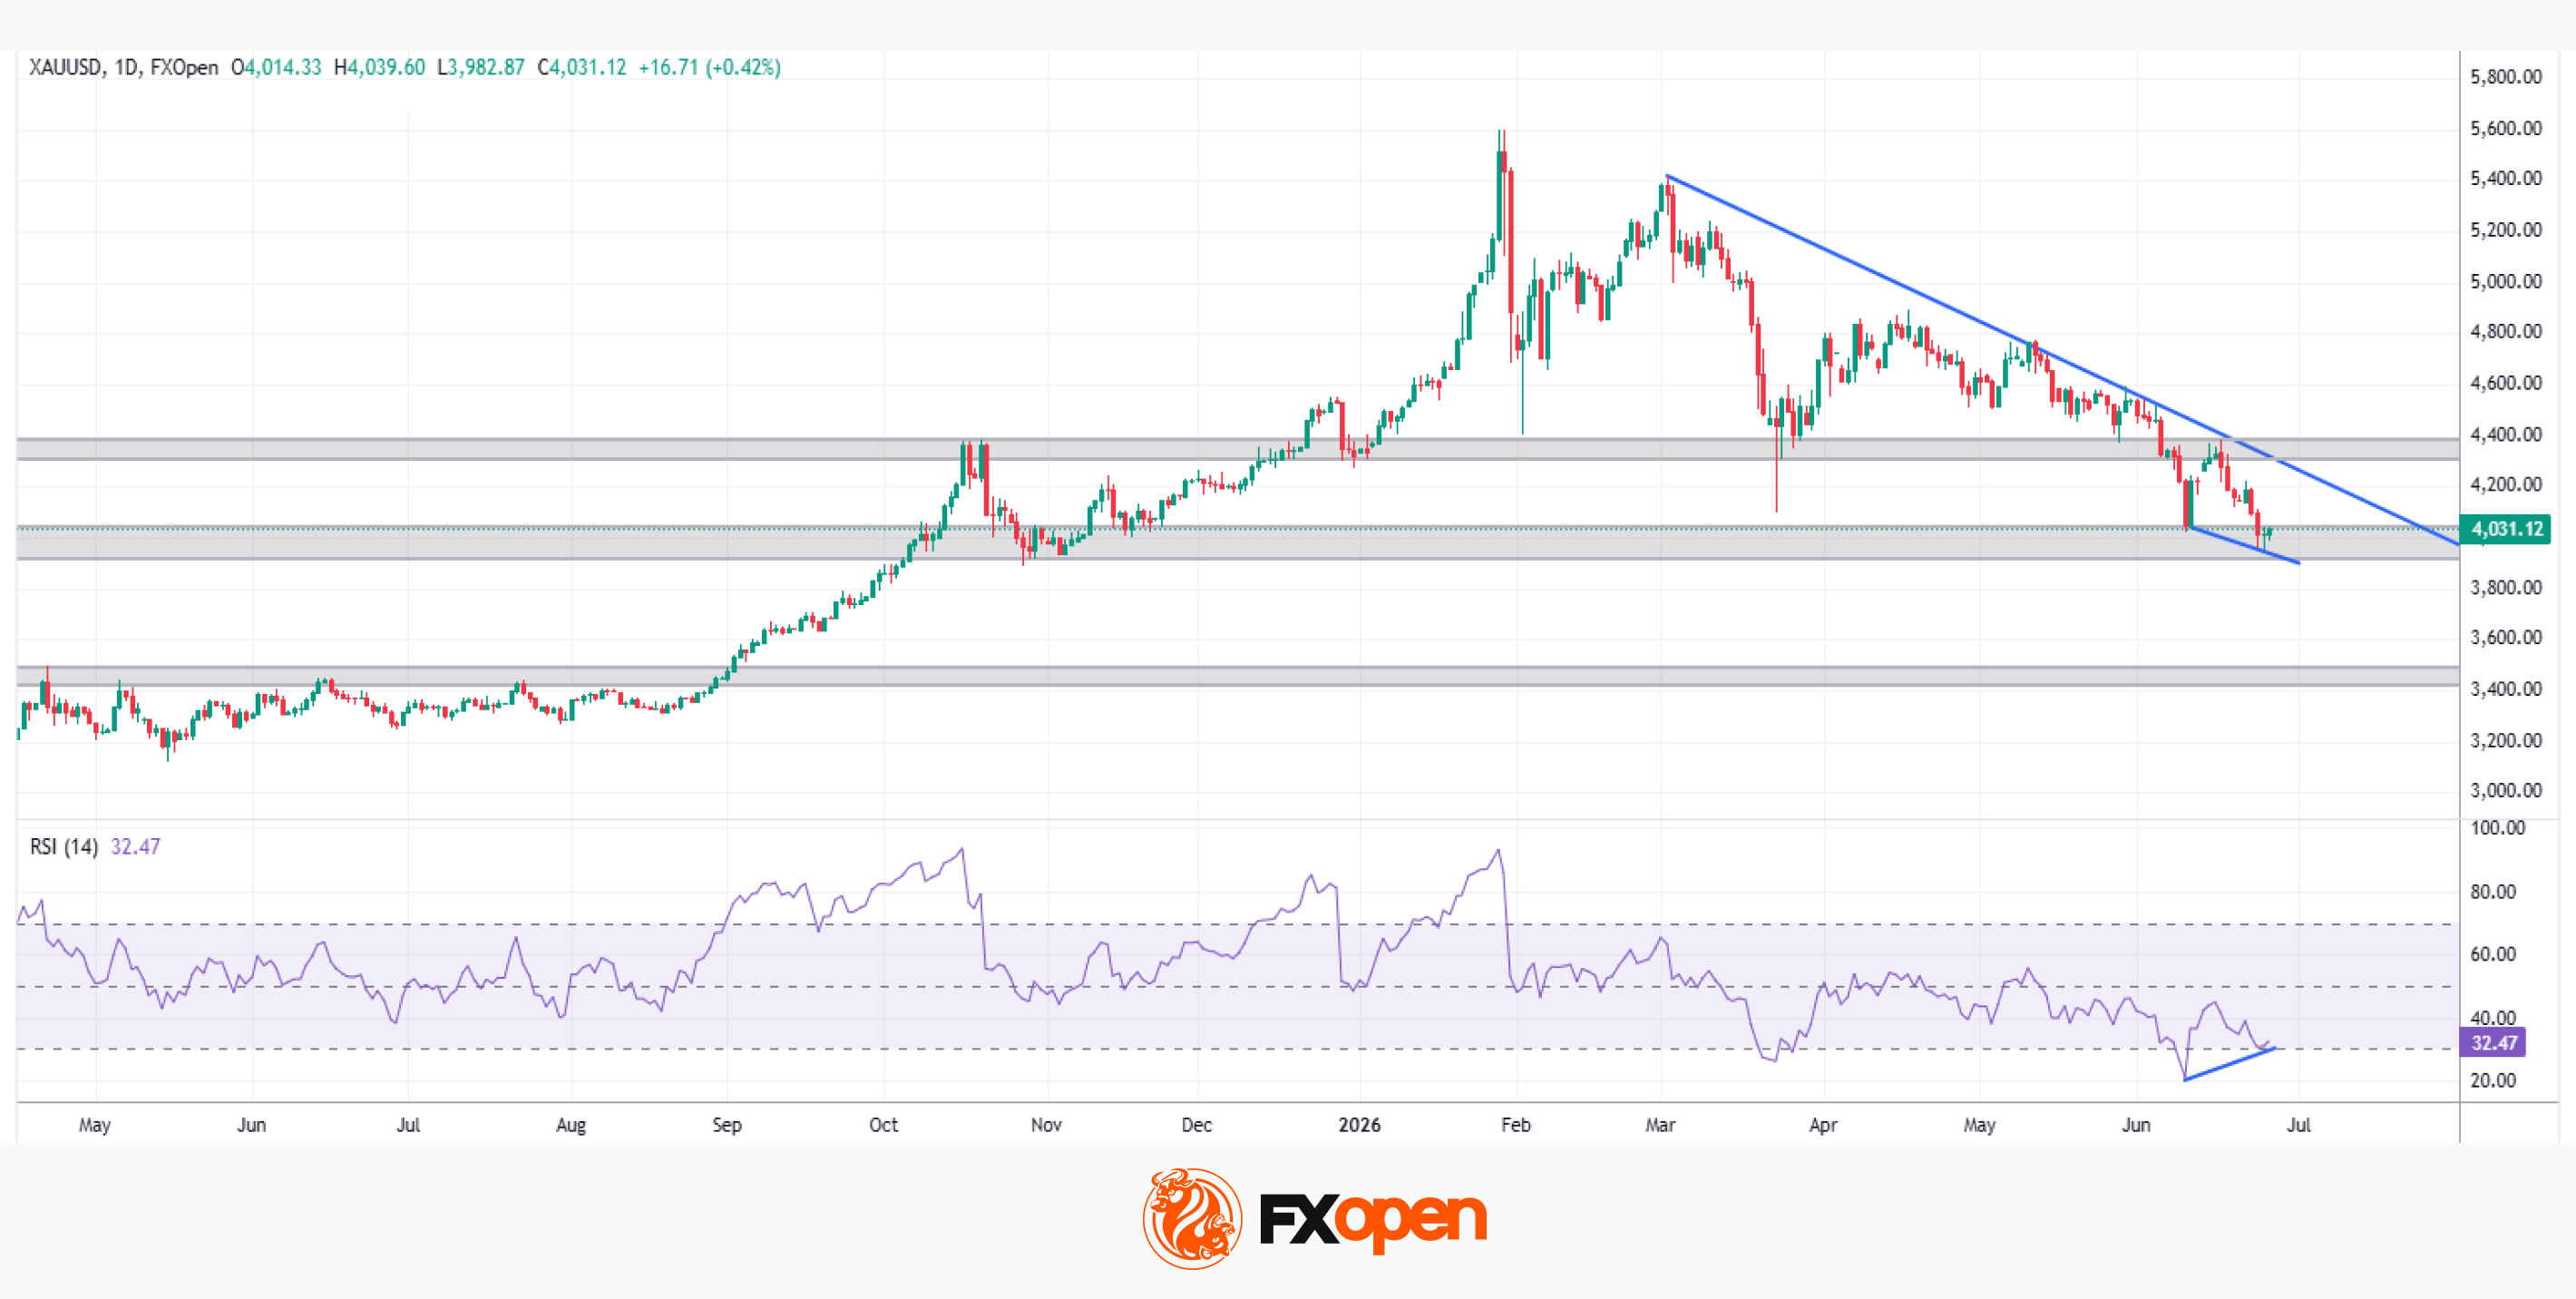
Gold is currently navigating a bearish structure in the short-to-medium term, with price consistently reacting to a descending trendline drawn from the highs of early March, forming a clear sequence of lower highs and lower lows on the daily chart.
Price has now arrived at a technically and psychologically significant area: the $4,000 per ounce. This zone has demonstrated its relevance on multiple occasions in the past, and Thursday's session (25 June) offered the first tentative signs of a reaction, with the daily candle closing in positive territory.
→ Bullish scenario: A sustained reaction from the $4,000 zone, accompanied by a confirmed break above the descending trendline — which converges with resistance in the $4,300–$4,380 area — would establish a new sequence of higher highs and open the door to a broader bullish recovery.
→ Bearish scenario: A decisive break below $4,000, followed by a retest and breach of recent lows, would confirm the continuation of the medium-term downtrend, potentially exposing the $3,400–$3,500 zone — a former major resistance that now acts as structural support.
Both scenarios remain open. Price action on the H4 and H1 timeframes will be key to determining gold's next directional move in the sessions ahead.
Start trading commodity CFDs with tight spreads (additional fees may apply). Open your trading account now or learn more about trading commodity CFDs with FXOpen.
This article represents the opinion of the Companies operating under the FXOpen brand only. It is not to be construed as an offer, solicitation, or recommendation with respect to products and services provided by the Companies operating under the FXOpen brand, nor is it to be considered financial advice.
Stay ahead of the market!
Subscribe now to our mailing list and receive the latest market news and insights delivered directly to your inbox.


Latest articles

CAD/JPY: The Yen's Most Historic Move in 30 Years Meets a Fragile Support
Two central banks are heading in genuinely opposite directions this week, and the tension is unmistakable. The Bank of Canada held rates steady at 2.25% on September 2, with a mildly hawkish tilt as policymakers acknowledged a broadening economic

USD/JPY and USD/CAD Await Key Fed Decision
The US dollar is consolidating against the yen and Canadian dollar ahead of the key event of the week — the Federal Reserve meeting. The Fed is widely expected to raise its policy rate by 25 basis points to a range

UnitedHealth: Fundamentals Are Healing, Now the Chart Must Agree
UnitedHealth finds itself in a genuinely split narrative right now, trading near $388, down about 15.9% from its 52-week high, even as the fundamental picture keeps improving. Q2 earnings beat expectations, with revenue of $112.03 billion, and the