


Nasdaq 100 Analysis: Is This The Beginning of a Deeper Correction?
FXOpen

As the chart shows, the Nasdaq 100 (US Tech 100 Mini on FXOpen) is down more than 6% from its recent highs, with Friday, 6 June, standing out as the defining session: a single-day loss of approximately 4.74% marked the worst daily performance of 2026.
The S&P 500 (US SPX 500 Mini on FXOpen) declined around 4% from its highs, while the Dow Jones (Wall Street 30 Mini on FXOpen) posted a more contained loss of approximately 3%. Investors and traders are now asking the same question: Is this the beginning of a deeper correction, or simply an isolated bout of volatility?
Why Did US Markets Sell Off?
The sell-off was driven by a combination of geopolitical, macroeconomic, and technical factors. On the geopolitical front, US/Israel–Iran negotiations have shown signs of escalation in recent days, injecting uncertainty into already fragile risk sentiment.
The primary catalyst, however, was Friday's Non-Farm Payrolls report, which showed 172,000 jobs added compared with forecasts of just 85,000. The stronger-than-expected reading sent the US dollar sharply higher, putting pressure on all inversely correlated assets, including equity indices, gold, silver, forex pairs, and cryptocurrencies.
Adding further headwinds, Wednesday's CPI print showed inflation holding at 4.2% (Core CPI: 2.9%), potentially pushing the Fed, now under new Chair Warsh, to keep rates on hold for longer.
Technical Analysis of the Nasdaq 100
The chart presents two contrasting scenarios.
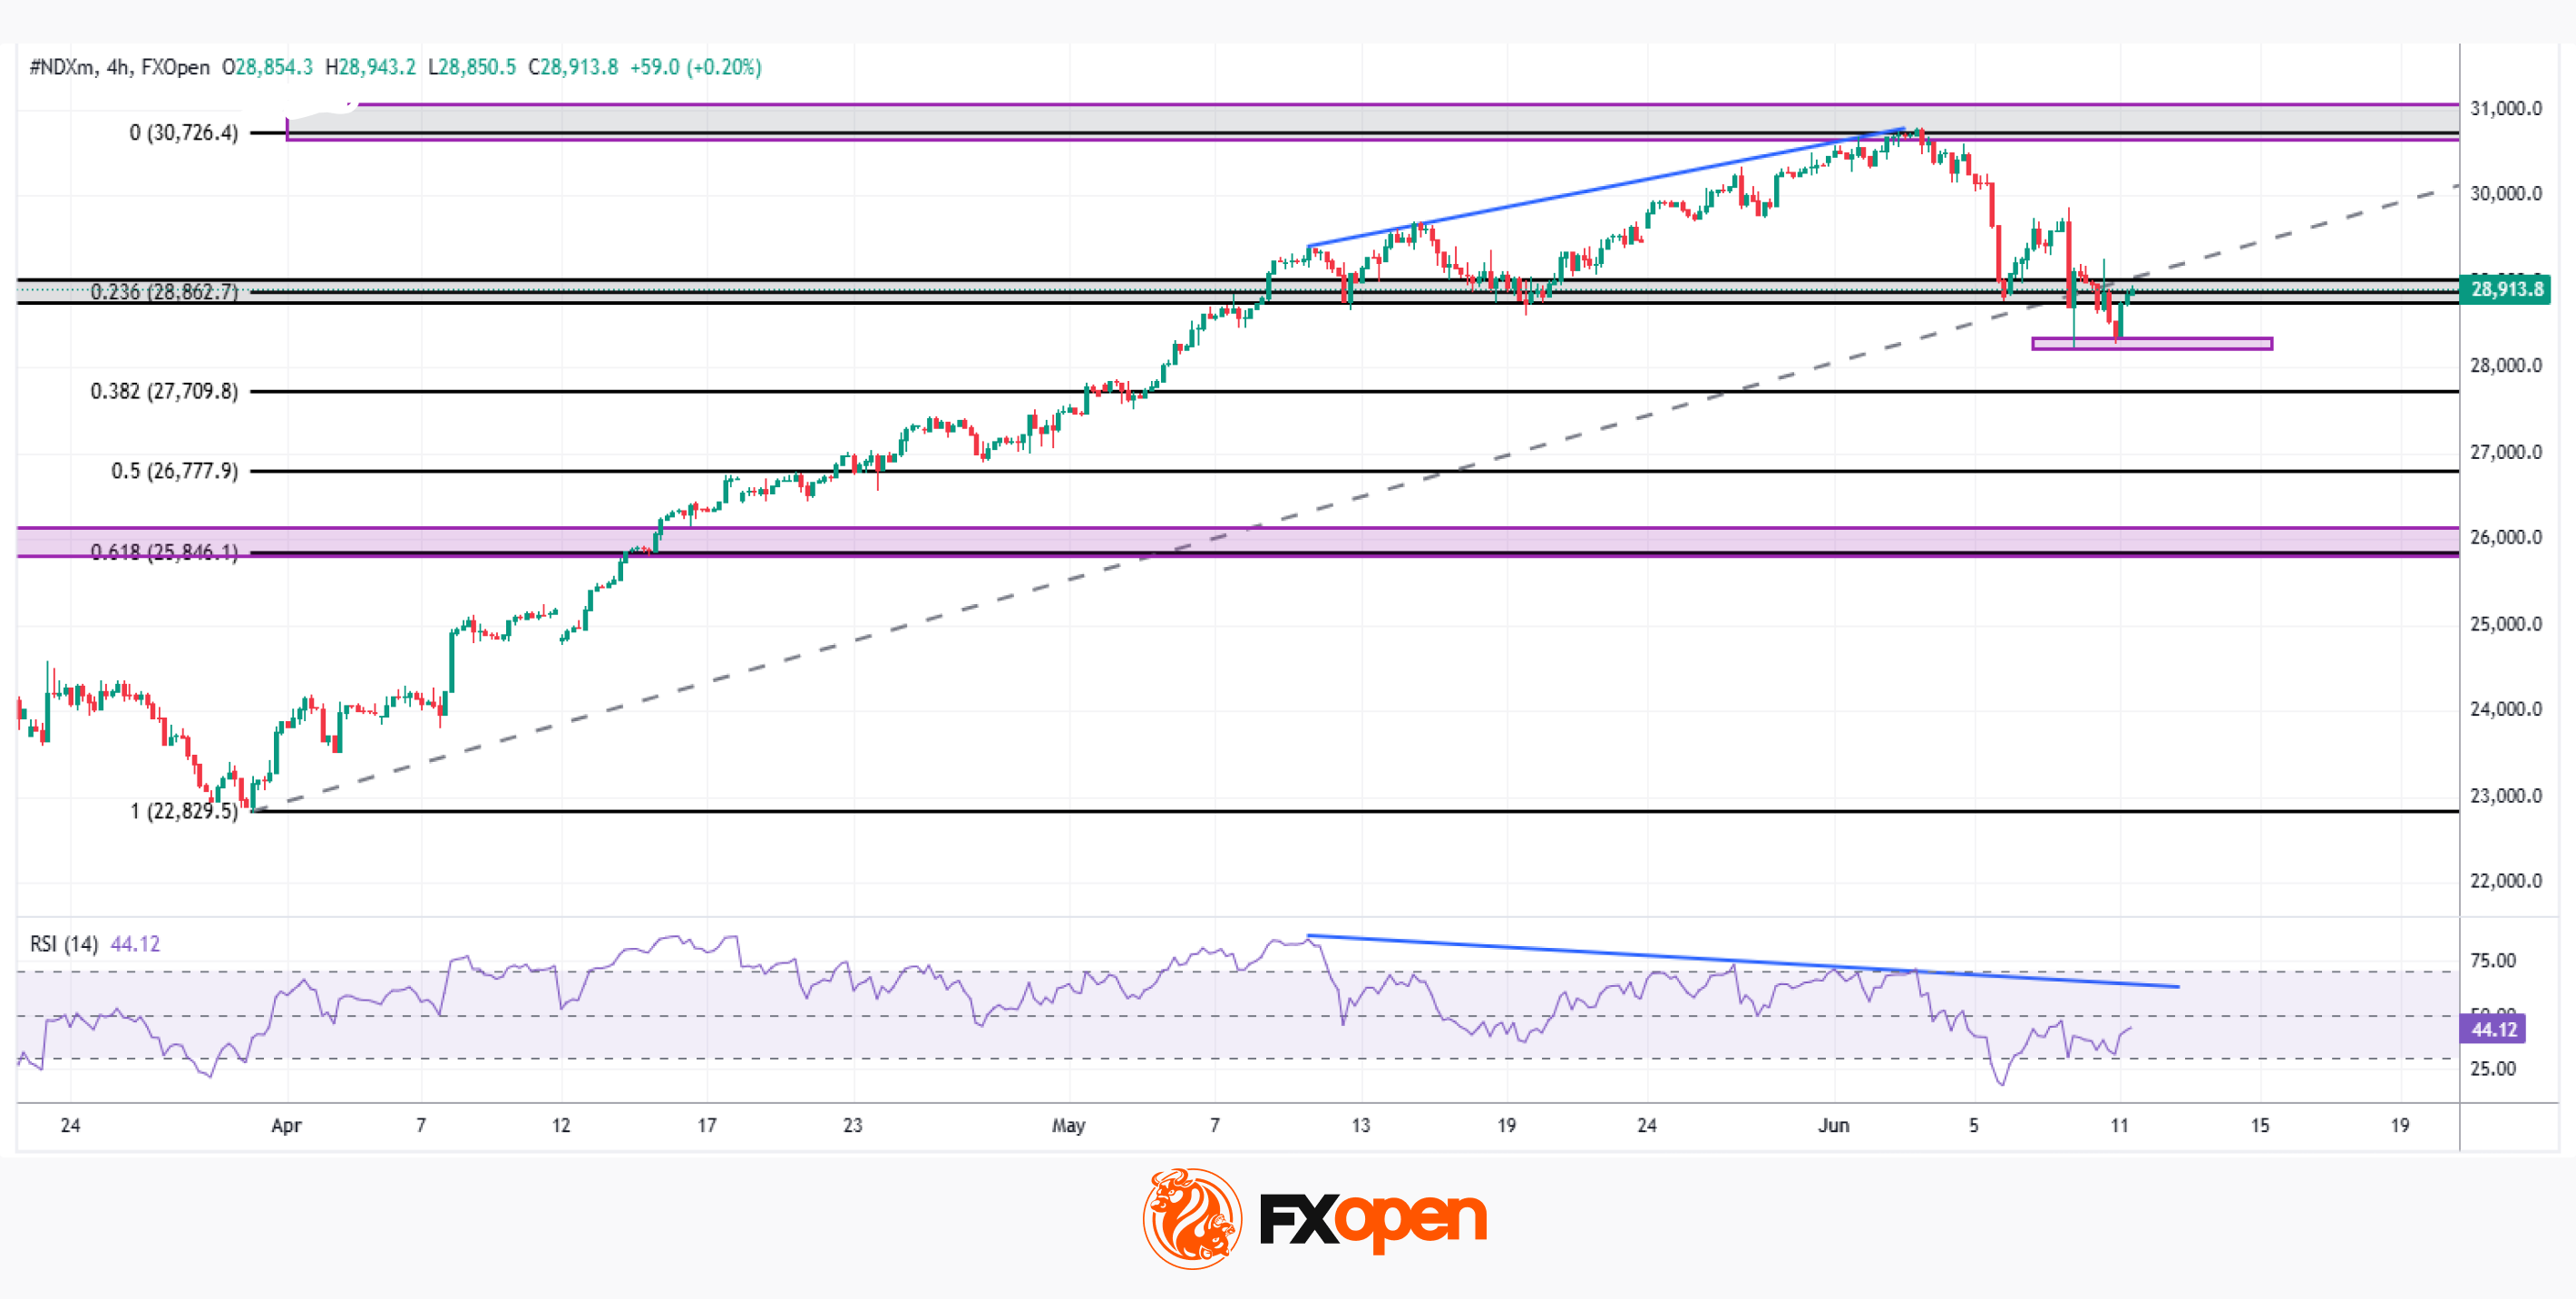
On the bullish side, the price defended the 28,200–28,300 support zone twice, triggering a rebound toward the 28,800–29,000 region, a key former support level now acting as resistance. A clean break above this level could suggest the broader uptrend remains intact, while a rejection might initiate a sequence of lower highs and lower lows.
On the bearish side, a confirmed break below the lows of 9 and 11 June could potentially expose the 25,800–26,000 zone — where a key former resistance and the 0.618 Fibonacci retracement of the late-March rally converge. An RSI divergence on the 4H time-frame, already visible before the sell-off, appears to be playing out in support of this scenario.
With dollar strength, sticky inflation, and geopolitical risk all weighing on sentiment, these levels could prove decisive in the sessions ahead.
Trade global index CFDs with zero commission and tight spreads (additional fees may apply). Open your FXOpen account now or learn more about trading index CFDs with FXOpen.
This article represents the opinion of the Companies operating under the FXOpen brand only. It is not to be construed as an offer, solicitation, or recommendation with respect to products and services provided by the Companies operating under the FXOpen brand, nor is it to be considered financial advice.
Stay ahead of the market!
Subscribe now to our mailing list and receive the latest market news and insights delivered directly to your inbox.


Latest articles

Brent Crude Oil: From Ceasefire to Crossfire — What's Next?
Just weeks ago, traders were pricing in peace. Now they're pricing in war again—and that reversal says everything about how fragile the current Middle East calm really is.
Brent crude has surged to $86 a barrel, its highest level

AUD/USD and USD/CAD React to Softer US Inflation
Commodity-linked currencies strengthened after US inflation data came in weaker than expected. The Consumer Price Index (CPI) slowed to 3.5% year-on-year in June, below the 3.8% forecast, while core inflation eased to 2.6% versus expectations of 2.

NVIDIA: Kyber NVL144 Dispute Weighs on the Stock
NVIDIA shares found themselves at the centre of debate over the future of the Kyber NVL144 system. On 6 July, CNBC, citing research firm SemiAnalysis, reported that the project could be delayed by more than a year—from 2027 to