


USD/CAD: One Trendline Away From Deciding the Next Move
FXOpen
After several strongly positive weeks, USD/CAD has stalled over the past few sessions, entering a phase of uncertainty.
On the dollar side, Fed Chair Kevin Warsh has struck a firm tone, reaffirming the 2% inflation target and pushing back against political pressure to cut rates, while sticky PCE inflation near 4% keeps hike odds alive for September. Yet June payrolls came in softer and speculative USD positioning looks stretched, raising doubts on how much further the rally can extend. Markets will also watch upcoming US CPI and PPI releases closely, as either gauge could reinforce the Fed hike case or, if softer, cap dollar strength.
The loonie's story is similarly mixed. Canada's June jobs report beat expectations, reducing the odds of a BoC cut, yet the currency remains capped by falling oil prices, subdued inflation, and unresolved CUSMA trade uncertainty. Two currencies face both genuine support and headwinds, leaving USD/CAD hostage to this week's BoC decision and incoming US data—a backdrop that aligns well with what the chart itself is showing.
USD/CAD Technical analysis
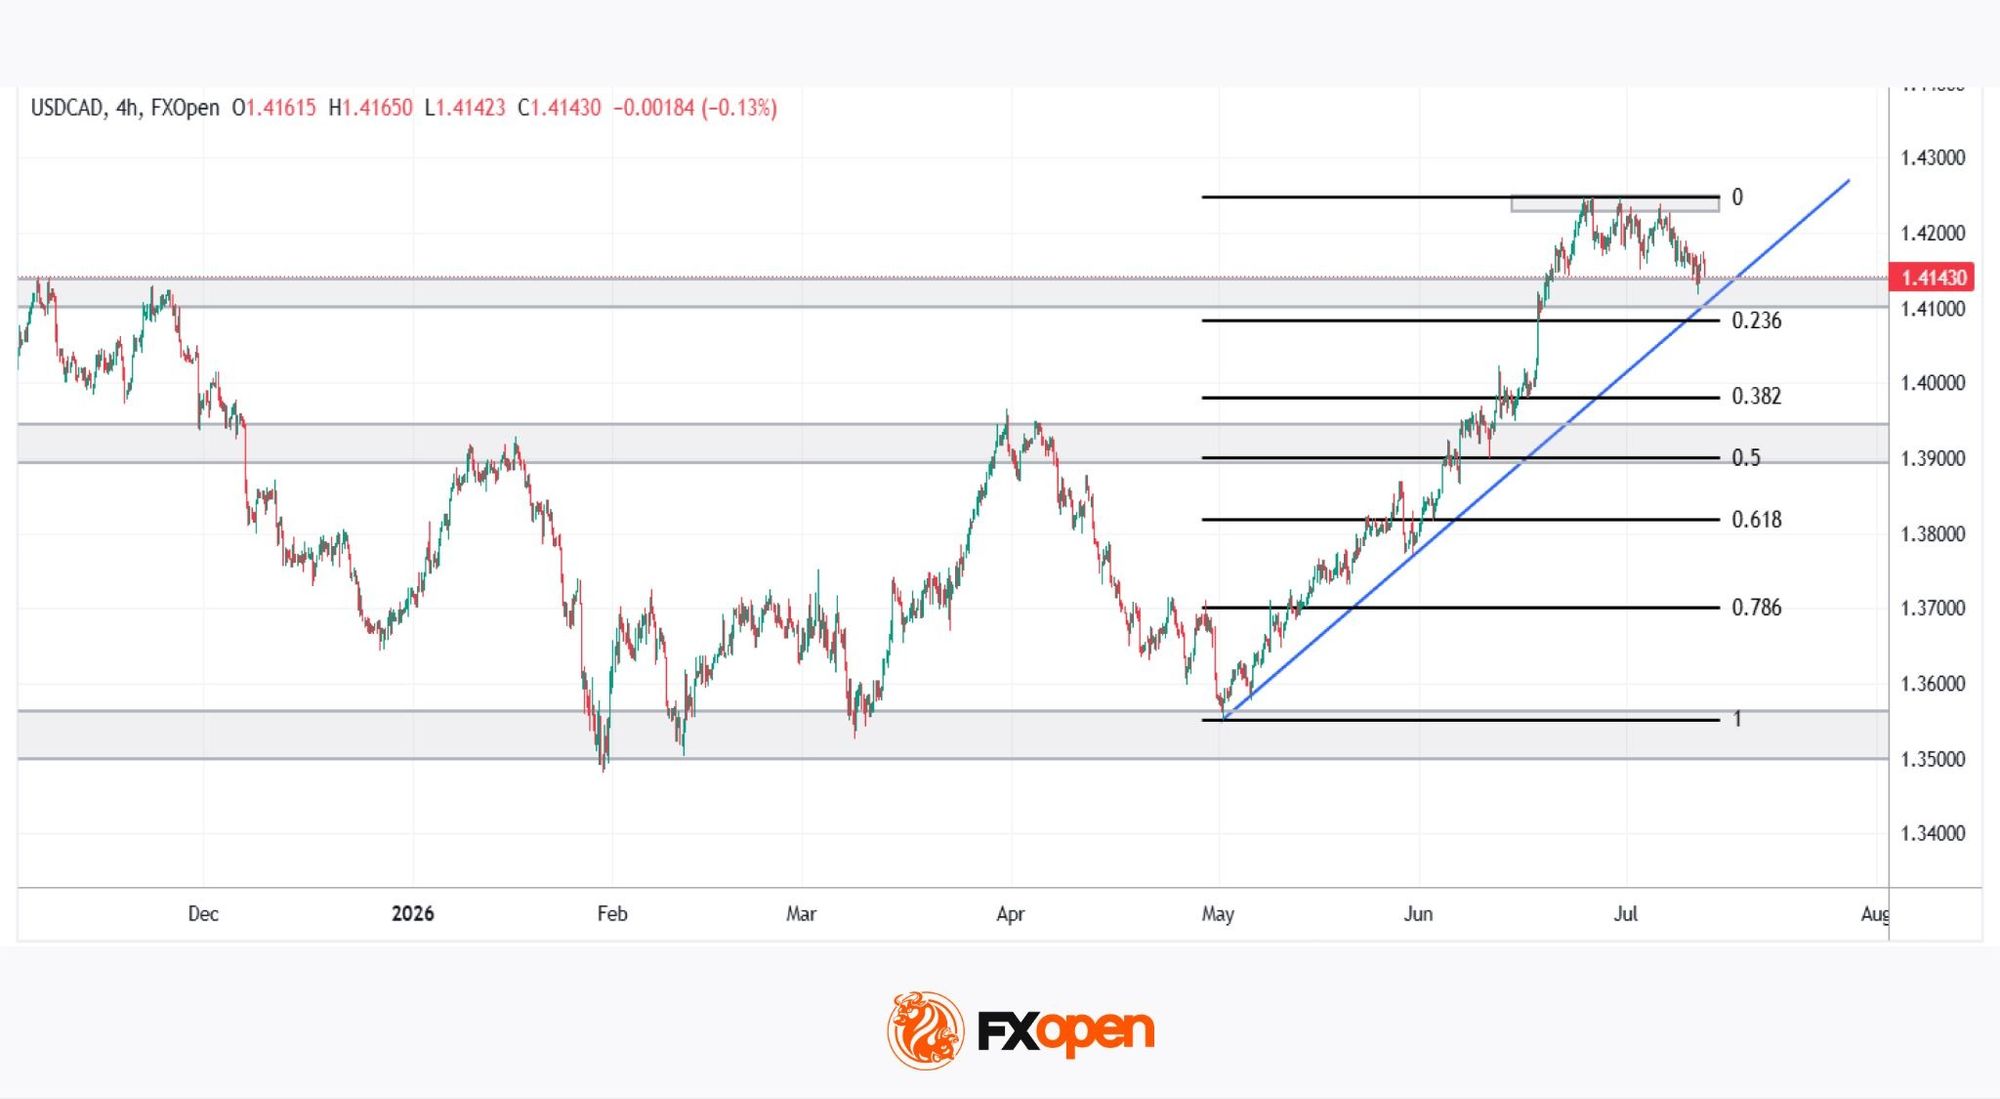
As the 4H chart shows, USD/CAD has traded within a well-defined ascending channel since May's lows, and is now consolidating just below recent swing highs. The Fibonacci retracement drawn from that low to the July high offers a useful reference for the levels ahead.
Bullish Scenario
As long as price holds above the ascending trendline and defends the former resistance, now turned support, in the 1.4100 area, the broader uptrend structure remains firmly intact, and this pause looks far more like healthy consolidation than an early reversal signal. A confirmed bounce off the trendline, followed by a decisive push back above the recent swing high near the 1.4250 area, would validate continued bullish control and open the way for USD/CAD to extend its rally into fresh highs for the move, keeping the dollar's medium-term strength against the loonie firmly in place.
Bearish Scenario
A clean, sustained break below the ascending trendline would mark the first real technical warning sign, shifting near-term momentum decisively lower. In that case, the 0.382 and 0.5 Fibonacci retracement levels would become the first meaningful support tests, coinciding with the psychological 1.3900-1.4000 range. Losing these levels could expose a deeper slide towards the 0.618 retracement—an area that would confirm a genuine correction of the entire May-to-July rally rather than a simple pullback, and would put the pair's medium-term bullish structure into serious question.
With price sitting right on the ascending trendline, the coming sessions could prove decisive in determining where USD/CAD heads next.
Trade over 50 forex markets 24 hours a day with FXOpen. Take advantage of low commissions, deep liquidity, and spreads from 0.0 pips (additional fees may apply). Open your FXOpen account now or learn more about trading forex with FXOpen.
This article represents the opinion of the Companies operating under the FXOpen brand only. It is not to be construed as an offer, solicitation, or recommendation with respect to products and services provided by the Companies operating under the FXOpen brand, nor is it to be considered financial advice.
Stay ahead of the market!
Subscribe now to our mailing list and receive the latest market news and insights delivered directly to your inbox.


Latest articles

CAD/JPY: The Yen's Most Historic Move in 30 Years Meets a Fragile Support
Two central banks are heading in genuinely opposite directions this week, and the tension is unmistakable. The Bank of Canada held rates steady at 2.25% on September 2, with a mildly hawkish tilt as policymakers acknowledged a broadening economic

USD/JPY and USD/CAD Await Key Fed Decision
The US dollar is consolidating against the yen and Canadian dollar ahead of the key event of the week — the Federal Reserve meeting. The Fed is widely expected to raise its policy rate by 25 basis points to a range

UnitedHealth: Fundamentals Are Healing, Now the Chart Must Agree
UnitedHealth finds itself in a genuinely split narrative right now, trading near $388, down about 15.9% from its 52-week high, even as the fundamental picture keeps improving. Q2 earnings beat expectations, with revenue of $112.03 billion, and the