


XAU/USD: Gold Tests Its Trendline After a Powerful August Rally
FXOpen

Gold has staged a remarkable comeback, surging almost 14% in August alone and reclaiming levels not seen since May, a stark reversal from late July, when prices had dipped below $4,000. The rally has been driven by a genuinely unusual combination of forces: the US Treasury's surprise decision to double its long-dated bond buyback programme reignited fears over fiscal credibility and dollar debasement, while persistent Middle East tensions and steady Chinese buying have kept safe-haven demand firmly in place.
All eyes now turn to Fed Chair Kevin Warsh's Jackson Hole speech, the week's pivotal event. A hawkish tone or a fresh rise in real yields could trigger meaningful profit-taking after such a sharp run-up, while continued dollar weakness would likely keep gold's momentum intact. Adding to the tension, this week's data slate, including preliminary Q2 GDP, jobless claims, and Michigan's inflation expectations, gives markets plenty of reasons to stay on edge.
With gold already up nearly 96% over the past year and testing territory unseen in months, the metal finds itself balancing two powerful forces: genuine structural demand against a market that may finally be due for a pause.
Technical Analysis of XAU/USD
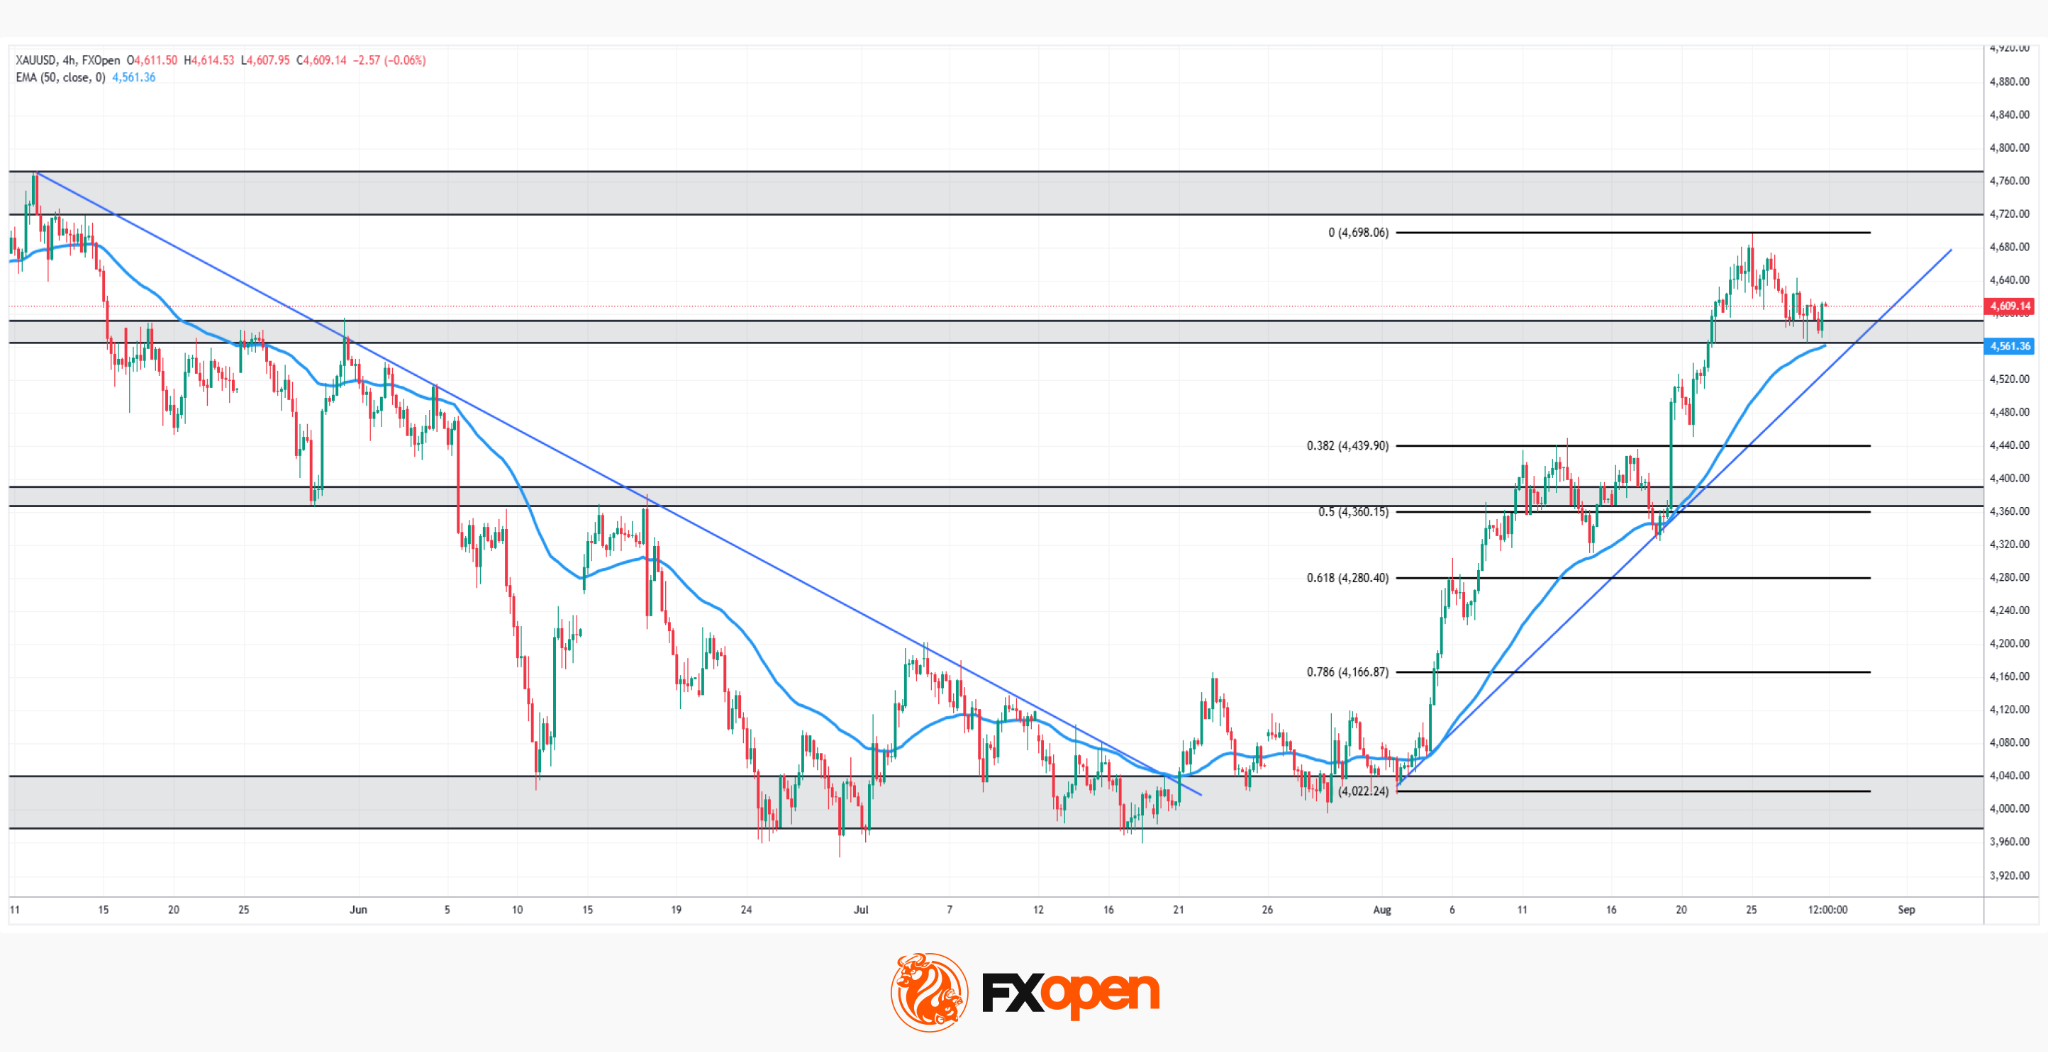
As the XAU/USD chart shows, gold has been trading within a well-respected ascending trendline since the 4,022 low in late July, having earlier broken decisively above the descending trendline that capped the May–July decline. Price recently touched a fresh high near 4,698, the 0 Fibonacci level, before pulling back and now testing the confluence of the ascending trendline and the 50-period EMA near 4,561.
Bullish Scenario
Should buyers defend this trendline-EMA confluence, the broader uptrend structure remains firmly intact. A renewed push higher would target a retest of the 4,698 high, with a confirmed break above that level opening the door toward the 4,760–4,800 resistance zone and fresh record territory beyond.
Bearish Scenario
Conversely, a decisive break below the ascending trendline and the 50-period EMA would signal that a deeper correction is underway, exposing the 0.382 Fibonacci retracement near 4,440 as the first real test, with a further slide risking a retest of the 0.5 level around 4,360.
With price sitting right at the intersection of a multi-week trendline and the 50-period EMA, gold's next move looks set to determine whether this powerful August rally has more room to run or whether it's due for a deeper pause.
Start trading commodity CFDs with tight spreads (additional fees may apply). Open your trading account now or learn more about trading commodity CFDs with FXOpen.
This article represents the opinion of the Companies operating under the FXOpen brand only. It is not to be construed as an offer, solicitation, or recommendation with respect to products and services provided by the Companies operating under the FXOpen brand, nor is it to be considered financial advice.
Stay ahead of the market!
Subscribe now to our mailing list and receive the latest market news and insights delivered directly to your inbox.


Latest articles

CAD/JPY: The Yen's Most Historic Move in 30 Years Meets a Fragile Support
Two central banks are heading in genuinely opposite directions this week, and the tension is unmistakable. The Bank of Canada held rates steady at 2.25% on September 2, with a mildly hawkish tilt as policymakers acknowledged a broadening economic

USD/JPY and USD/CAD Await Key Fed Decision
The US dollar is consolidating against the yen and Canadian dollar ahead of the key event of the week — the Federal Reserve meeting. The Fed is widely expected to raise its policy rate by 25 basis points to a range

UnitedHealth: Fundamentals Are Healing, Now the Chart Must Agree
UnitedHealth finds itself in a genuinely split narrative right now, trading near $388, down about 15.9% from its 52-week high, even as the fundamental picture keeps improving. Q2 earnings beat expectations, with revenue of $112.03 billion, and the