


FXOpen

Navigating the complex landscape of forex trading requires a nuanced understanding of currency correlations. This article discusses the various aspects of the concept, from its definition to practical applications in the world of forex trading.
Understanding Forex Currency Correlation
Acknowledging the correlation concept may help traders get a better understanding of forex market conditions and aid in the planning of their trades.
Currency correlations refer to the statistical relationship between different currency pairs, revealing how they tend to move in relation to each other. This concept is grounded in the idea that the values of currencies can be influenced by common factors such as economic indicators, interest rates, and market sentiment.
Historical and Dynamic Correlations
Observing the historical and dynamic relation between forex pairs that correlate provides a nuanced perspective on the evolving nature of market relationships. Historical price data shows the patterns and trends over time, offering insights into how pairs have moved in relation to each other in various market conditions. On the other hand, dynamic correlations acknowledge the ever-changing nature of financial markets.
Influencing Factors
Economic indicators of a country, such as inflation rates and employment figures, serve as fundamental drivers influencing the strength or weakness of its currency. Also central to the landscape are interest rates, with decisions made by central banks impacting currency values significantly. Market sentiment also contributes to the ebb and flow of currency interrelations.

Interpreting Currency Correlations
The relationship between currency pairs can vary in terms of intensity and duration. Let’s explore how traders measure correlations and which aspects they need to consider.
Identifying Strong and Weak Relationships
The correlation coefficient is the technical indicator that quantifies the degree to which two currency pairs move in relation to each other. A reading close to +1 indicates a strong positive correlation, while a coefficient near -1 signifies a strong negative correlation. An indicator reading near 0 suggests a weak or non-existent correlation.
Correlation Between Forex Pairs May Change Over Time
Major economic shifts and events can alter the relationships between currency pairs. The usual negative correlation can transform into a positive one, showcasing how economic turbulence can reshape established relationships. For example, AUD/USD and GBP/USD pairs have a strong positive correlation on the daily chart, which becomes neutral on the weekly timeframe. If we consider a monthly period, the correlation will become positive again.
Correlations can manifest differently over various timeframes. Short-term correlations may be influenced by daily economic releases or unexpected events, while long-term correlations may be shaped by broader economic trends, including adjustments in a country's interest rates, alterations in monetary policies, or a combination of economic and political events. Short-term correlations may guide intraday or swing trading, while long-term correlations can influence position trading and investment decisions. The suitability of timeframes is closely tied to the chosen forex correlation strategies.
Tools and Resources for Currency Correlations Analysis
In addition to the correlation coefficient, there may be custom indicators to calculate and display currency correlations. These indicators can be programmed to suit your specific needs and preferences. Charting platforms equipped with customisation features also enable the simultaneous visualisation of multiple pairs, aiding in the identification of patterns and trends. Forex correlation matrices, available on various trading platforms, offer a comprehensive overview of the interdependencies of currency pairs.
Types of Currency Pair Correlation
The relative movements of forex pairs can be discussed from two different perspectives. Below, we delve into that matter, offering some practical examples.
Currency Correlations
While analysing the interrelationship between currency pairs, traders distinguish between three types of correlation.
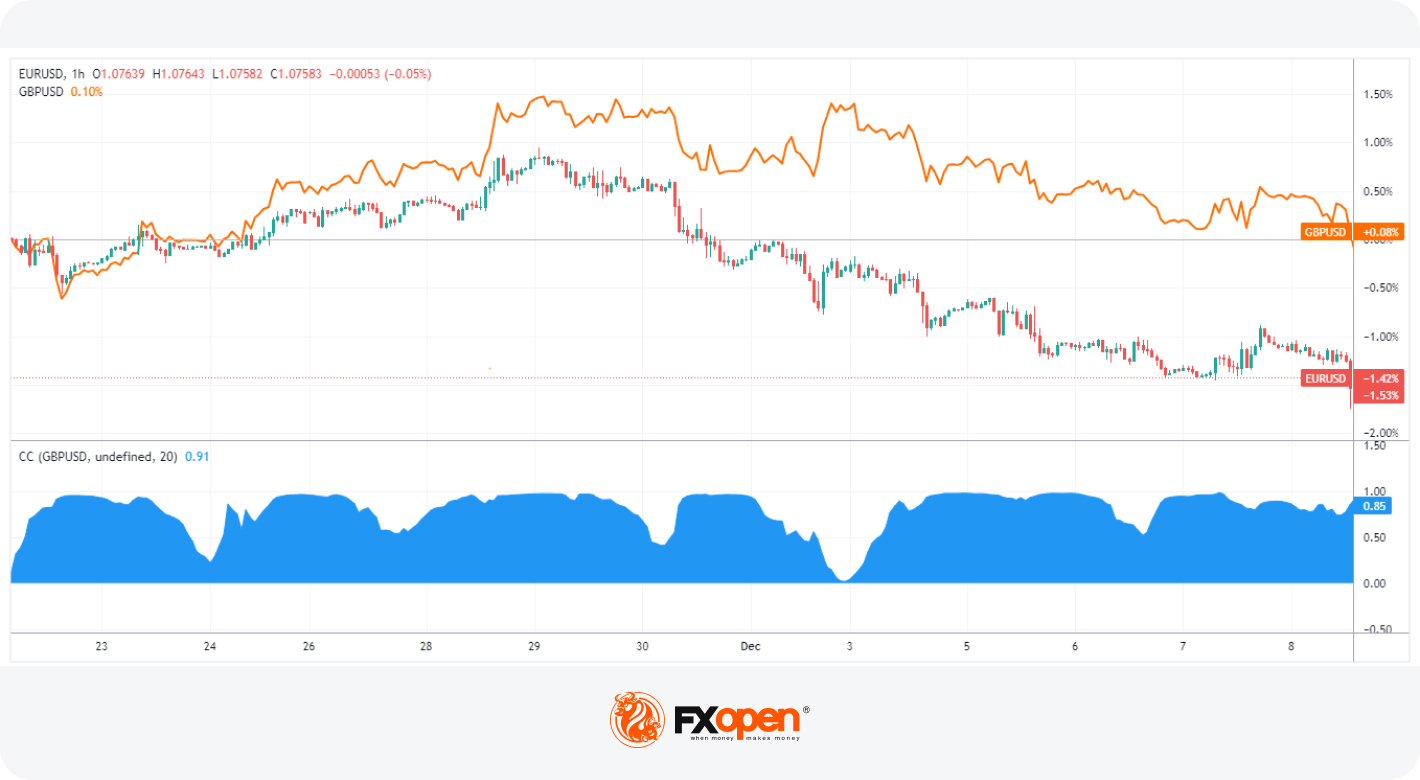
- Positive: EUR/USD and GBP/USD
A positive relationship is when two currency pairs move in the same direction. Over a specific period, when the EUR/USD experiences an upward movement, the GBP/USD also tends to rise correspondingly.
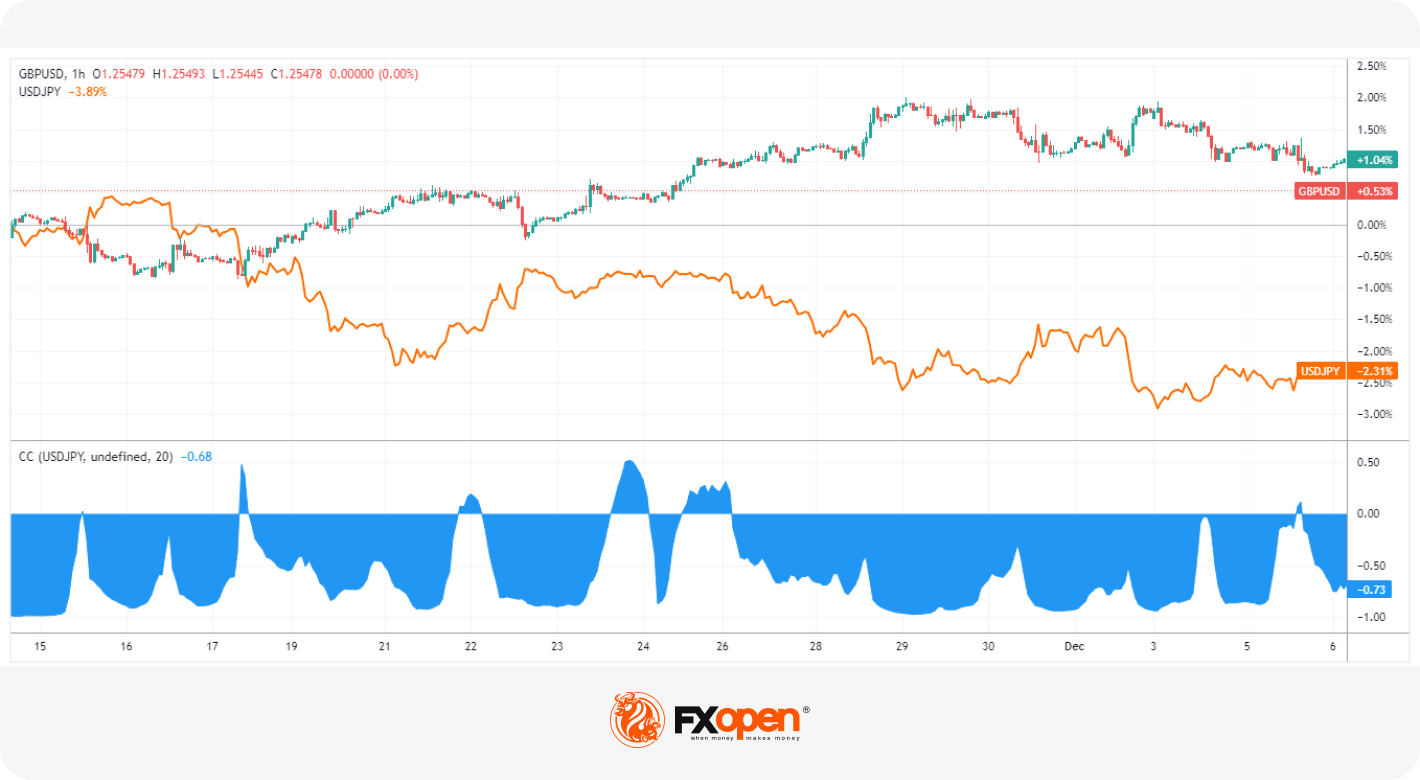
- Negative: GBP/USD and USD/JPY
Negative correlations indicate movement in opposite directions. For example, when the USD/JPY experiences an upward trend, the GBP/USD tends to exhibit a downward movement, and vice versa.
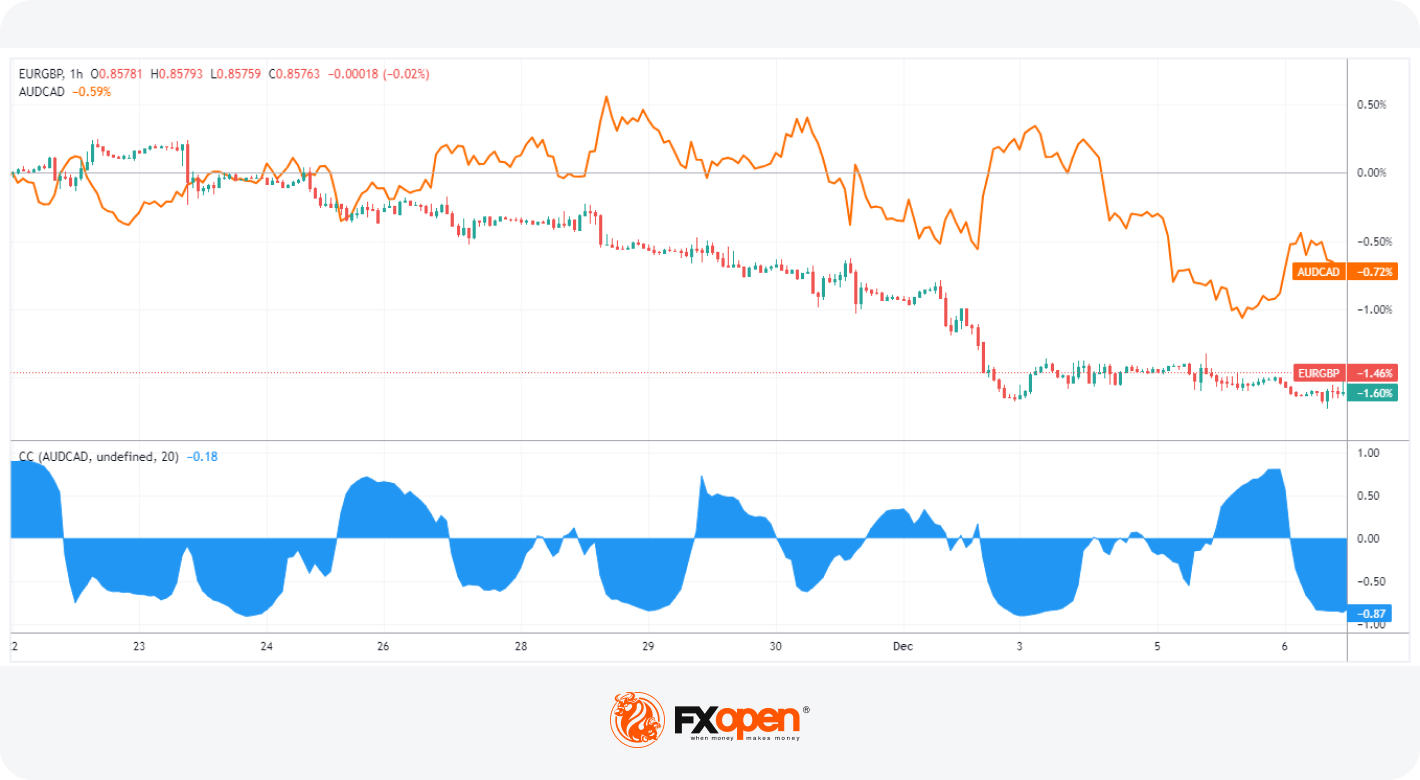
- Neutral: EUR/GBP and AUD/CAD
This is the case when there is no systematic relation between the exchange rates of the two currencies. The chart below shows that the price movements of EUR/GBP and AUD/CAD currency pairs do not exhibit a consistent pattern of moving in the same or opposite directions.
Curious about how other pairs move in relation to each other? Visit FXOpen and try out TickTrader’s free charting tools.
Intermarket Correlations
In addition to currency pairs, intermarket correlations explore the interconnected relationships between various financial assets. For instance, the relative price movements between currency pairs and commodities or equity markets can influence forex trading strategies. Traders always consider these broader market dynamics to make informed trading decisions.
Risk Management
By identifying pairs with negative correlations, traders can potentially offset losses in one position with gains in another through a good hedging strategy. Positive patterns, on the other hand, can help confirm trends and reinforce trading strategies. Incorporating correlations into risk management strategies may help traders assess the overall risk exposure of their portfolios more accurately.
Challenges and Limitations
One challenge lies in the dynamic nature of correlations, which can shift unpredictably in response to economic events or changing market sentiment. Over-reliance on historical data poses a risk, as past patterns may not necessarily repeat in the future. Additionally, currency pairs are influenced by various global markets, while liquidity issues in certain currency pairs may affect the reliability of the patterns identified, particularly in times of heightened market volatility.
Takeaway
Understanding currency correlations is one of the key components in designing forex strategies. While their analysis offers valuable insights, a broader approach that considers various other market factors is essential for effective performance in forex trading. Ready to try your forex strategies? You can open an FXOpen account today!
This article represents the opinion of the Companies operating under the FXOpen brand only. It is not to be construed as an offer, solicitation, or recommendation with respect to products and services provided by the Companies operating under the FXOpen brand, nor is it to be considered financial advice.
Stay ahead of the market!
Subscribe now to our mailing list and receive the latest market news and insights delivered directly to your inbox.


Latest articles

USD/CAD Rises to a Two-Month High
Today, the USD/CAD currency pair climbed above the 1.3787 level for the first time since late January.
→ Demand for the US dollar is being supported by concerns over escalating tensions in the Middle East. Market participants are favouring

Alphabet (GOOGL) Shares Fall to 2026 Low
As the chart shows, Alphabet (GOOGL) shares have dropped to their lowest level of 2026, with trading closing well below the psychological $300 per share mark.
Why Have Alphabet (GOOGL) Shares Declined?
The bearish move is driven by a combination

FX Market Awaits Macro Data: EUR/USD and GBP/USD Near Range Boundaries
European currencies are trading without a clear direction against the US dollar, remaining in a consolidation phase following the earlier decline driven by USD strength. At the start of the week, both EUR/USD and GBP/USD attempted a recovery,