


FXOpen
AUD/USD formed a solid support near 0.7060 and climbed higher. NZD/USD also gained upside momentum recently and broke the 0.6600 resistance.
Important Takeaways for AUD/USD and NZD/USD
- The Aussie Dollar started a solid upward move and traded above 0.7150 against the US Dollar.
- There was a break above a major ascending channel with resistance at 0.7140 on the hourly chart of AUD/USD.
- NZD/USD climbed higher recently and broke the 0.6570 and 0.6620 resistances.
- There is a short term ascending channel formed with support at 0.6645 on the hourly chart.
AUD/USD Technical Analysis
After trading towards the 0.7030 level, the Aussie Dollar found a strong buying interest against the US Dollar. As a result, the AUD/USD pair started a solid upward move and traded above the 0.7100 and 0.7120 resistance levels.
An intermediate swing low was formed at 0.7067 before buyers took control. They pushed the pair above the 0.7150 resistance and the 50 hourly simple moving average.
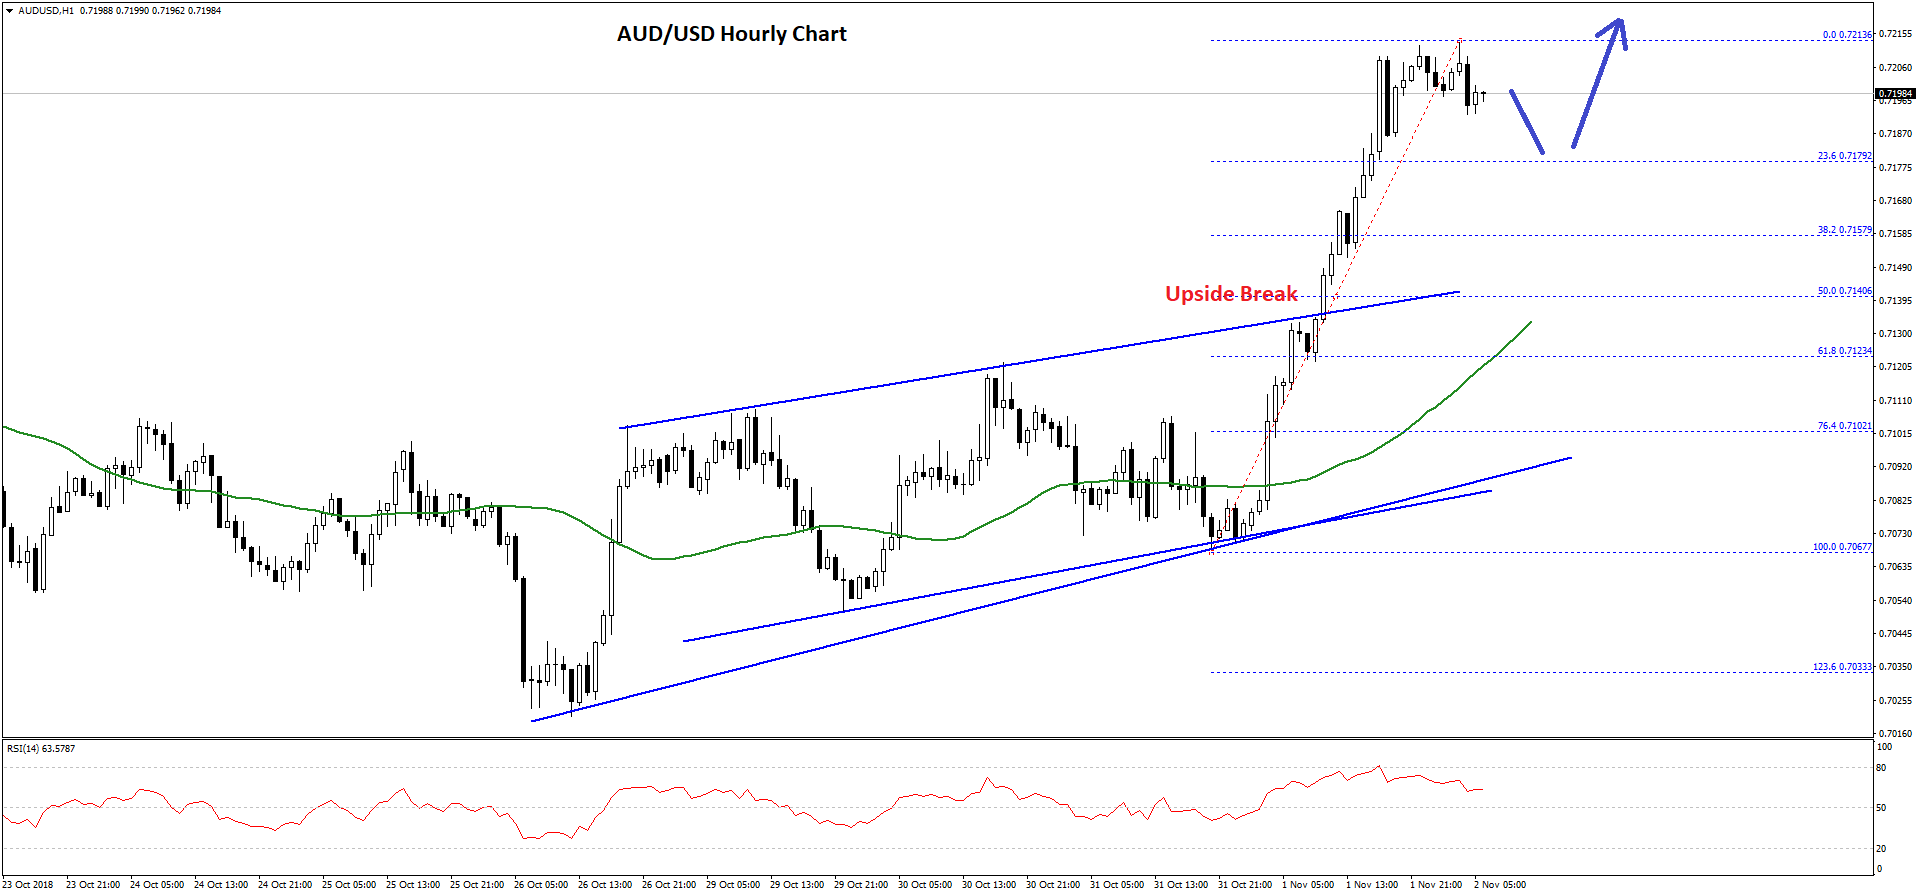
During the upward move, there was a break above a major ascending channel with resistance at 0.7140 on the hourly chart. It opened the gates for more gains and the pair cleared the 0.7180 and 0.7200 resistance levels.
The pair traded as high as 0.7213 recently and it is currently consolidating gains. An initial support is near the 23.6% Fib retracement level of the recent wave from the 0.7067 low to 0.7213 high.
If there is an extended downside correction below the 0.7180 support, the pair may perhaps trade towards the 0.7140 support. The 0.7140 support coincides with the broken channel and the 50% Fib retracement level of the recent wave from the 0.7067 low to 0.7213 high.
Therefore, dips from the current levels towards the 0.7180 or 0.7140 supports are likely to find a solid buying interest in the near term.
On the upside, the pair needs to clear the 0.7215 resistance to surpass the 0.7220 level. The main resistance on the upside awaits near 0.7250, which could prevent the current upside move.
NZD/USD Technical Analysis
The New Zealand Dollar declined this past week towards the 0.6470 level against the US Dollar. The NZD/USD pair found support near the 0.6470-80 zone and later started an upward move.
The pair gained traction recently and traded above the 0.6500 and 0.6550 resistance levels. There was also a close above the 0.6560 level and the 50 hourly simple moving average. The pair even broke the 0.6640 resistance and traded as high as 0.6665.
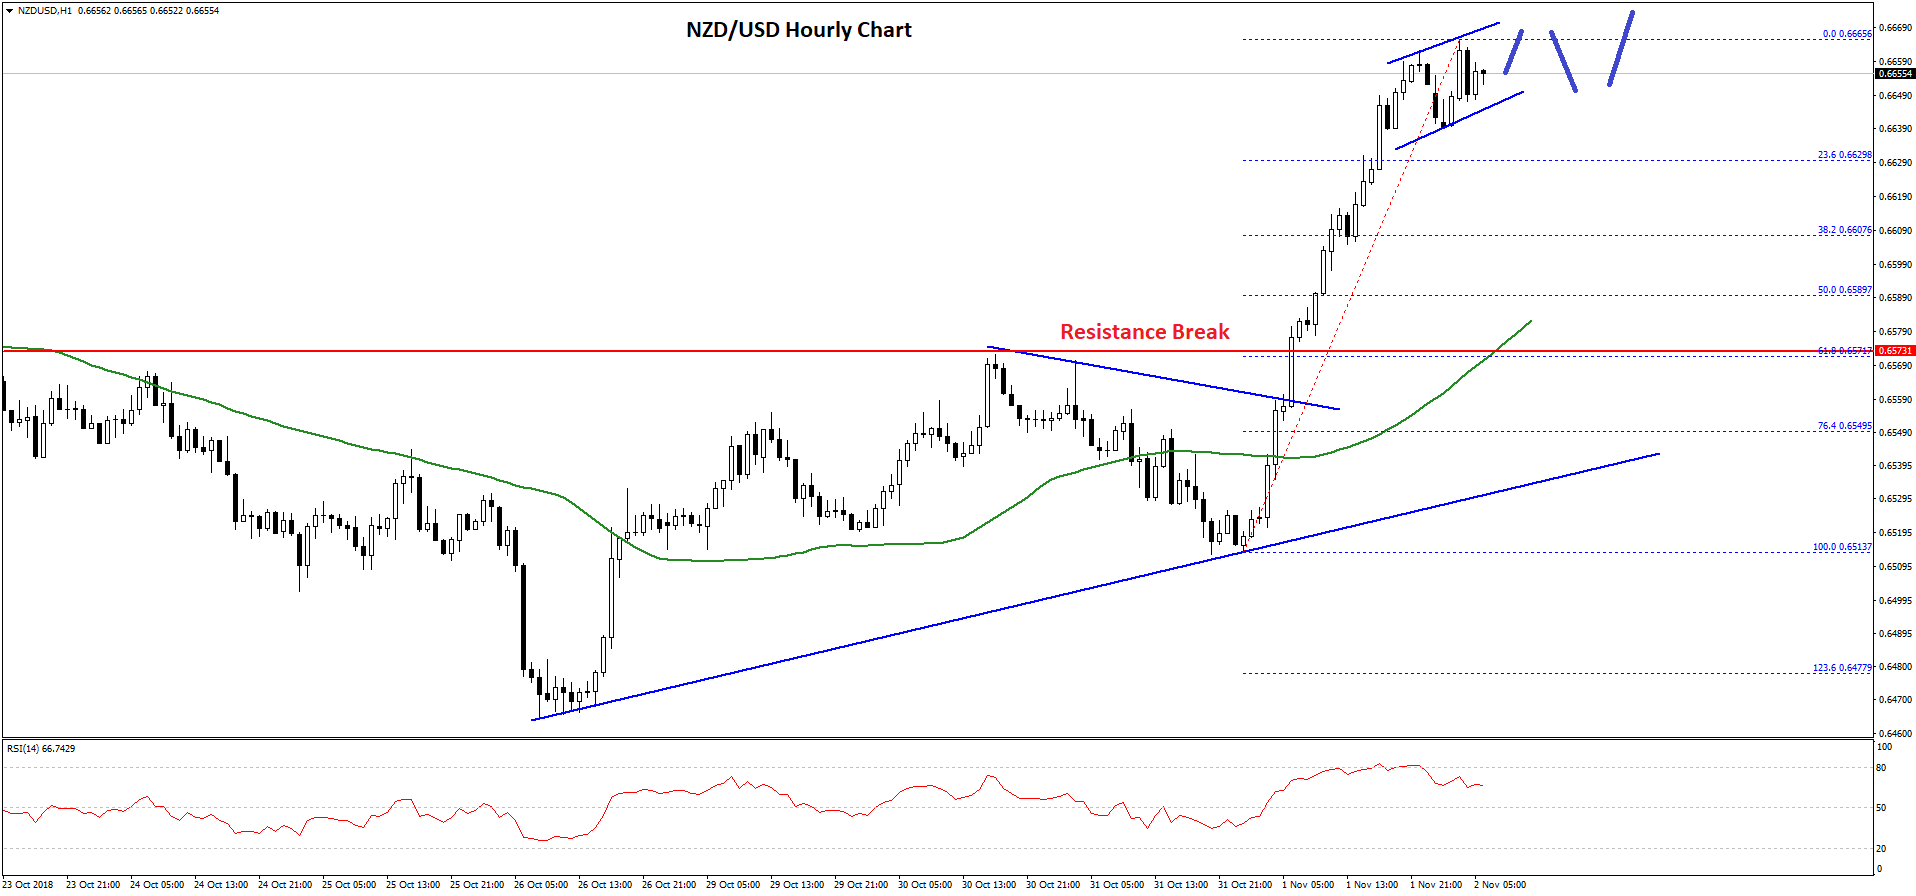
At the moment, the pair is consolidating gains above the 0.6640 level. Besides, it seems like there is a short term ascending channel formed with support at 0.6645 on the hourly chart.
The pair may correct a few pips in the near term and it could test the 23.6% Fib retracement level of the recent upside move from the 0.6513 low to 0.6665 high. However, the main support on the downside is near the 0.6600 level.
If the pair continues to correct lower, it could test the 50 hourly SMA and the 50% Fib retracement level of the recent upside move from the 0.6513 low to 0.6665 high near 0.6590.
On the upside, a break above the recent high at 0.6665 may clear the path for more gains. The next major hurdle for NZD/USD buyers is positioned near the 0.6700 level.
Trade over 50 forex markets 24 hours a day with FXOpen. Take advantage of low commissions, deep liquidity, and spreads from 0.0 pips (additional fees may apply). Open your FXOpen account now or learn more about trading forex with FXOpen.
This article represents the opinion of the Companies operating under the FXOpen brand only. It is not to be construed as an offer, solicitation, or recommendation with respect to products and services provided by the Companies operating under the FXOpen brand, nor is it to be considered financial advice.
Stay ahead of the market!
Subscribe now to our mailing list and receive the latest market news and insights delivered directly to your inbox.


Latest articles

Market Insights with Gary Thomson: Where Are Oil, Gas & Global Indices Heading?
In this video, we’ll explore the key economic events and market trends, shaping the financial landscape. Get ready for insights into financial markets to help you navigate the week ahead. Let’s dive in!
In this episode of Market

Netflix (NFLX) Shares Pull Back After a 30% Surge
On 21 January, while analysing the NFLX chart, we:
→ identified a descending channel and a resistance zone around the $100 level;
→ noted that Netflix shares were showing a sustained downtrend. Selling pressure had been triggered primarily by reports of a

US Dollar Index (DXY) Rises Above the 100 Level
Today the US Dollar Index (DXY) climbed above the psychological 100 mark for the first time in 2026, supported by a tense fundamental backdrop, with the military conflict in the Middle East acting as the main driver.
→ Financial market participants