


FXOpen

AUD/USD started a fresh decline from the 0.7275 zone. NZD/USD is also declining and there is a risk of a move below the 0.6720 support.
Important Takeaways for AUD/USD and NZD/USD
· The Aussie Dollar started another decline from well above the 0.7250 level against the US Dollar.
· There was a break below a key bullish trend line with support near 0.7200 on the hourly chart of AUD/USD.
· NZD/USD also declined sharply below the 0.6750 support zone.
· There is a connecting bearish trend line forming with resistance near 0.6790 on the hourly chart of NZD/USD.
AUD/USD Technical Analysis
The Aussie Dollar struggled to clear the 0.7275 level against the US Dollar. The AUD/USD pair started a fresh decline below the 0.7250 support level to move into a bearish zone.
The bears were able to push the pair below the 50% Fib retracement level of the upward move from the 0.7170 swing low to 0.7275 high (formed on FXOpen). Besides, there was a break below a key bullish trend line with support near 0.7200 on the hourly chart of AUD/USD.
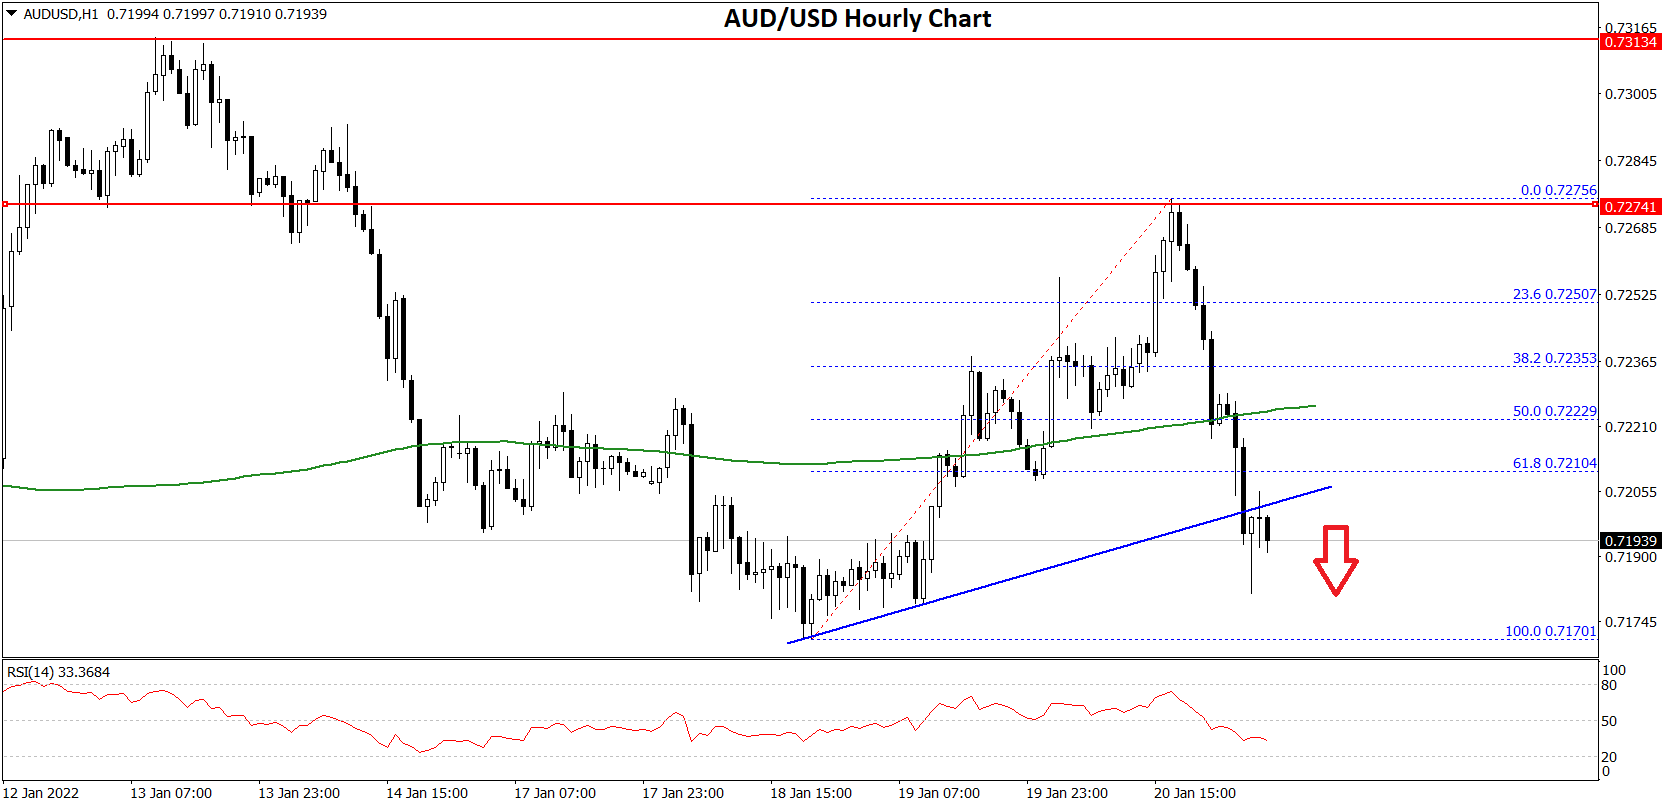
The pair settled below the 0.7220 support level and the 50 hourly simple moving average. It is now consolidating near the 0.7185 level.
The 76.4% Fib retracement level of the upward move from the 0.7170 swing low to 0.7275 high is also protecting losses. On the downside, an initial support is near the 0.7170 level. If there is a downside break below the 0.7170 support, the pair could extend its decline towards the 0.7125 level.
Any more downsides might send the pair toward the 0.7100 level. On the upside, the pair is facing resistance near the 0.7210 level.
The next major resistance is near the 0.7240 level. A close above the 0.7240 level could start a steady increase in the near term. The next major resistance could be 0.7300.
NZD/USD Technical Analysis
The New Zealand Dollar also followed a similar path from the 0.6800 zone against the US Dollar. The NZD/USD pair traded below the 0.6780 support zone to enter a bearish zone.
The pair even traded below the 0.6750 level and the 50 hourly simple moving average. A low was formed near 0.6723 and the pair is now consolidating losses. The pair is now struggling and facing resistance near the 0.6750 level.
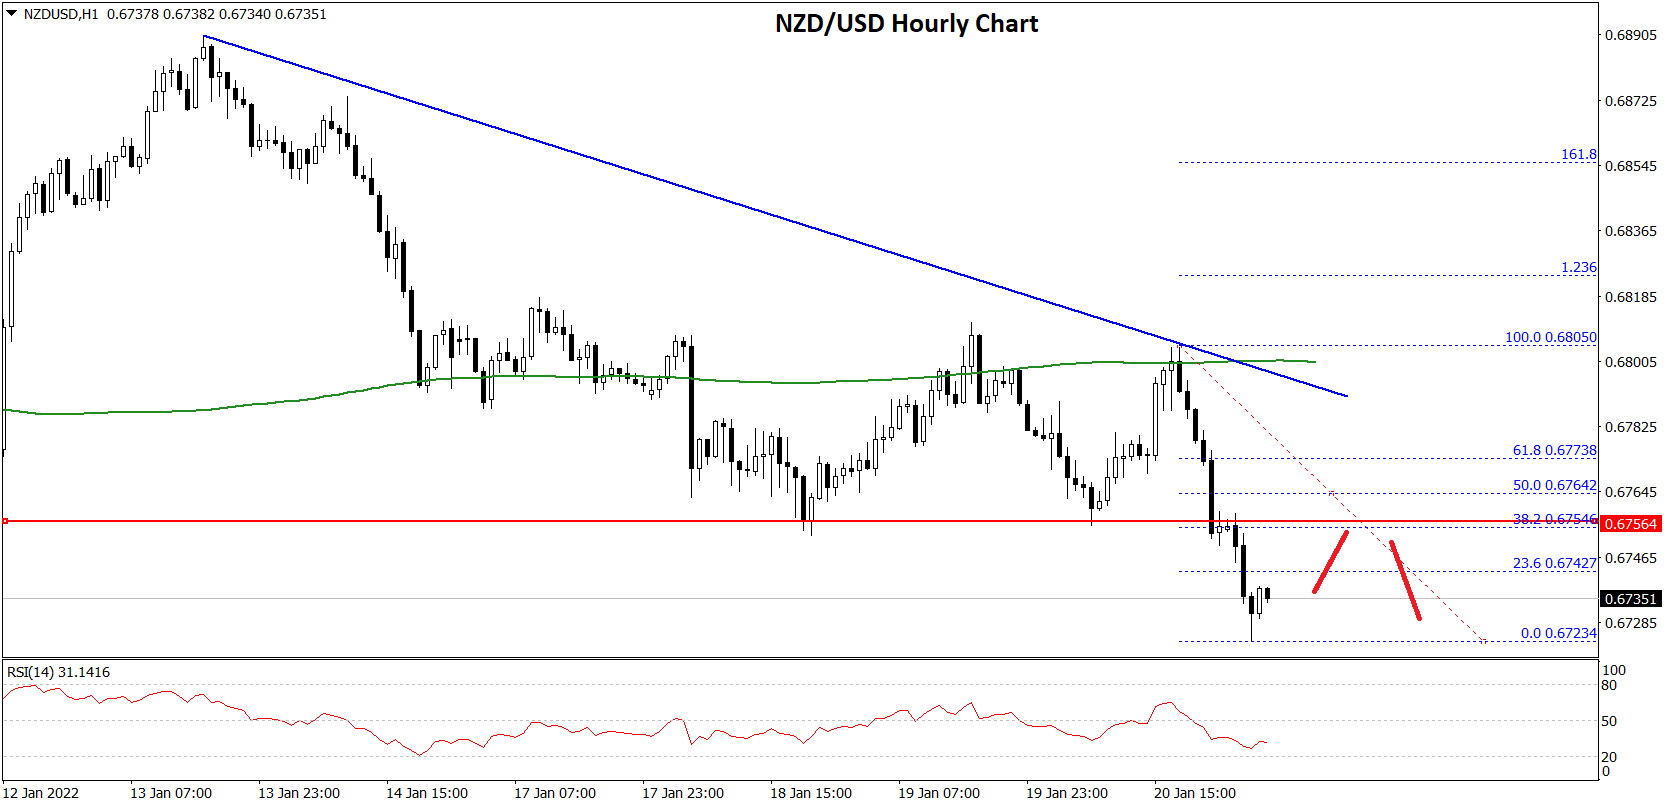
The first key resistance is near the 0.6765 level. It is near the 50% Fib retracement level of the downward move from the 0.6805 swing high to 0.6723 low.
The next major resistance is near the 0.6780 level. There is also a connecting bearish trend line forming with resistance near 0.6790 on the hourly chart of NZD/USD. The trend line is near the 76.4% Fib retracement level of the downward move from the 0.6805 swing high to 0.6723 low.
A clear move above the 0.6790 level might even push the pair above the 0.6800 level. In the stated case, the pair could rise towards the 0.6840 level.
On the downside, an initial support is near the 0.6725 level. The first key support is near the 0.6700 level, below which the pair could extend losses. The next major support is near the 0.6680 level. If there is a downside break below the 0.6680 support, the pair could extend its decline towards the 0.6650 level.
This forecast represents FXOpen Markets Limited opinion only, it should not be construed as an offer, invitation or recommendation in respect to FXOpen Markets Limited products and services or as financial advice.
Trade over 50 forex markets 24 hours a day with FXOpen. Take advantage of low commissions, deep liquidity, and spreads from 0.0 pips (additional fees may apply). Open your FXOpen account now or learn more about trading forex with FXOpen.
This article represents the opinion of the Companies operating under the FXOpen brand only. It is not to be construed as an offer, solicitation, or recommendation with respect to products and services provided by the Companies operating under the FXOpen brand, nor is it to be considered financial advice.
Stay ahead of the market!
Subscribe now to our mailing list and receive the latest market news and insights delivered directly to your inbox.


Latest articles

Market Insights with Gary Thomson: Where Are Oil, Gas & Global Indices Heading?
In this video, we’ll explore the key economic events and market trends, shaping the financial landscape. Get ready for insights into financial markets to help you navigate the week ahead. Let’s dive in!
In this episode of Market

Netflix (NFLX) Shares Pull Back After a 30% Surge
On 21 January, while analysing the NFLX chart, we:
→ identified a descending channel and a resistance zone around the $100 level;
→ noted that Netflix shares were showing a sustained downtrend. Selling pressure had been triggered primarily by reports of a

US Dollar Index (DXY) Rises Above the 100 Level
Today the US Dollar Index (DXY) climbed above the psychological 100 mark for the first time in 2026, supported by a tense fundamental backdrop, with the military conflict in the Middle East acting as the main driver.
→ Financial market participants