


AUD/USD Technical Analysis 23rd August 2021
FXOpen
The Aussie Dollar extended its decline and it tested the 0.7100 zone against the US Dollar. The AUD/USD pair traded as low as 0.7106 and it is now attempting an upside correction.
It recovered above the 0.7130 level, but it is facing many hurdles near the 50 hourly simple moving average. There is also a key bearish trend line forming with resistance near 0.7165 on the hourly chart.
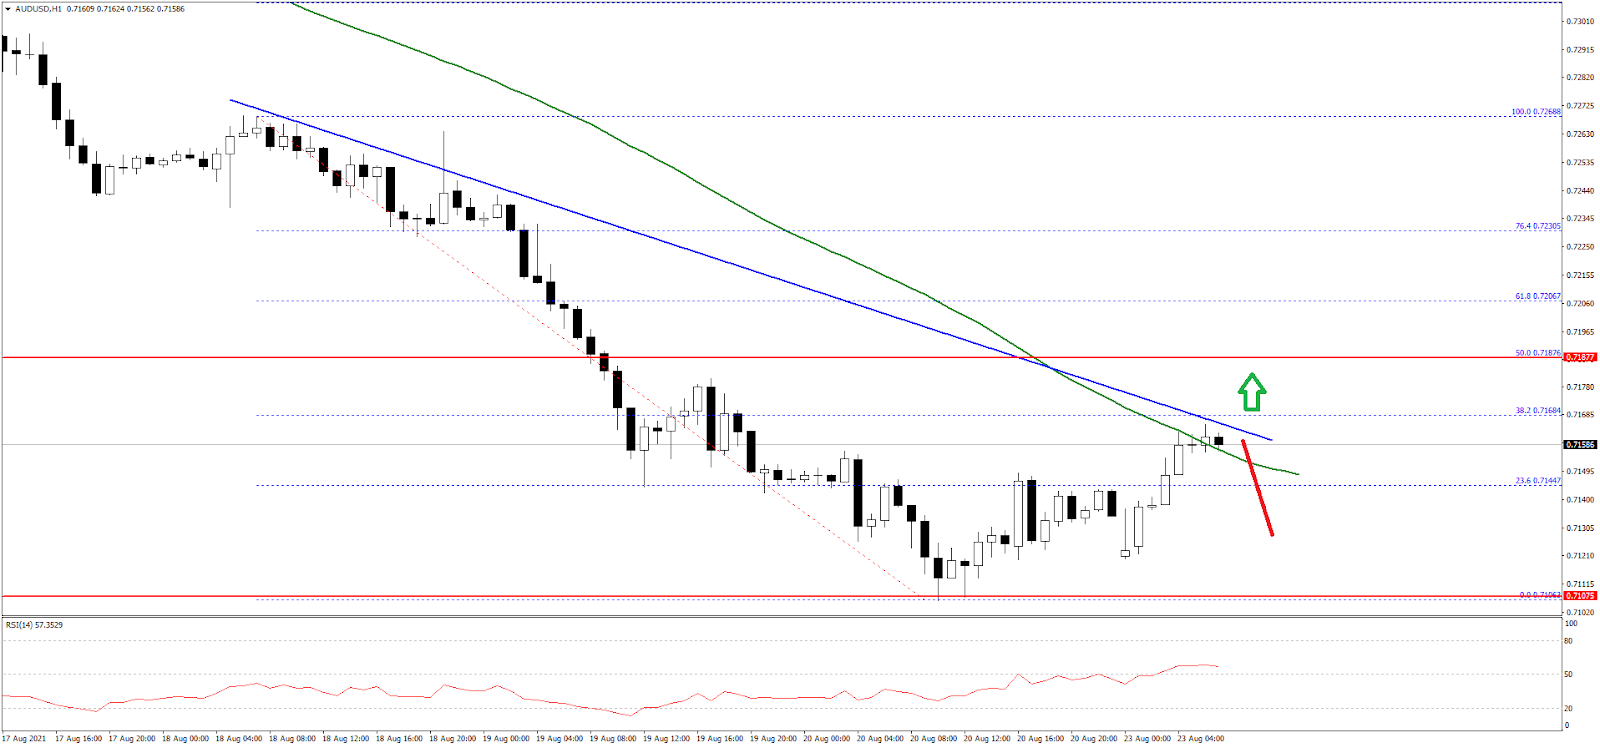
A clear break above the trend line resistance could lead the pair towards the 0.7200 resistance. The next major resistance for the bulls could be 0.7220.
If the pair fails to clear the trend line resistance, it could start a fresh decline below 0.7130. The next major support is near the 0.7100 level, below which there is a risk of a larger decline in the near term.
Trade over 50 forex markets 24 hours a day with FXOpen. Take advantage of low commissions, deep liquidity, and spreads from 0.0 pips (additional fees may apply). Open your FXOpen account now or learn more about trading forex with FXOpen.
This article represents the opinion of the Companies operating under the FXOpen brand only. It is not to be construed as an offer, solicitation, or recommendation with respect to products and services provided by the Companies operating under the FXOpen brand, nor is it to be considered financial advice.
Stay ahead of the market!
Subscribe now to our mailing list and receive the latest market news and insights delivered directly to your inbox.


Latest articles

Dow Jones (DJIA): Consolidation Beyond the Trend
Federal Reserve Chair Kevin Warsh testified before Congress on 14–15 July, reaffirming the Fed's commitment to bringing inflation back to target while providing no clear guidance on the future path of interest rates. Meanwhile, June inflation data came in

European Currencies Strengthen Ahead of Key Macroeconomic Releases
EUR/USD and GBP/USD continue to recover moderately following the recent weakening of the US dollar. European currencies have been supported by expectations that US inflationary pressures will continue to ease after softer-than-expected CPI and PPI data, reinforcing market

Brent Crude Oil: From Ceasefire to Crossfire — What's Next?
Just weeks ago, traders were pricing in peace. Now they're pricing in war again—and that reversal says everything about how fragile the current Middle East calm really is.
Brent crude has surged to $86 a barrel, its highest level