


Awesome Oscillator Trading Strategies
FXOpen

Navigating the world of trading indicators can be complex, but the Awesome Oscillator offers both simplicity and effectiveness. This article delves into how this indicator works, its best settings, and three strategies to use across all asset types.
Awesome Oscillator Explained
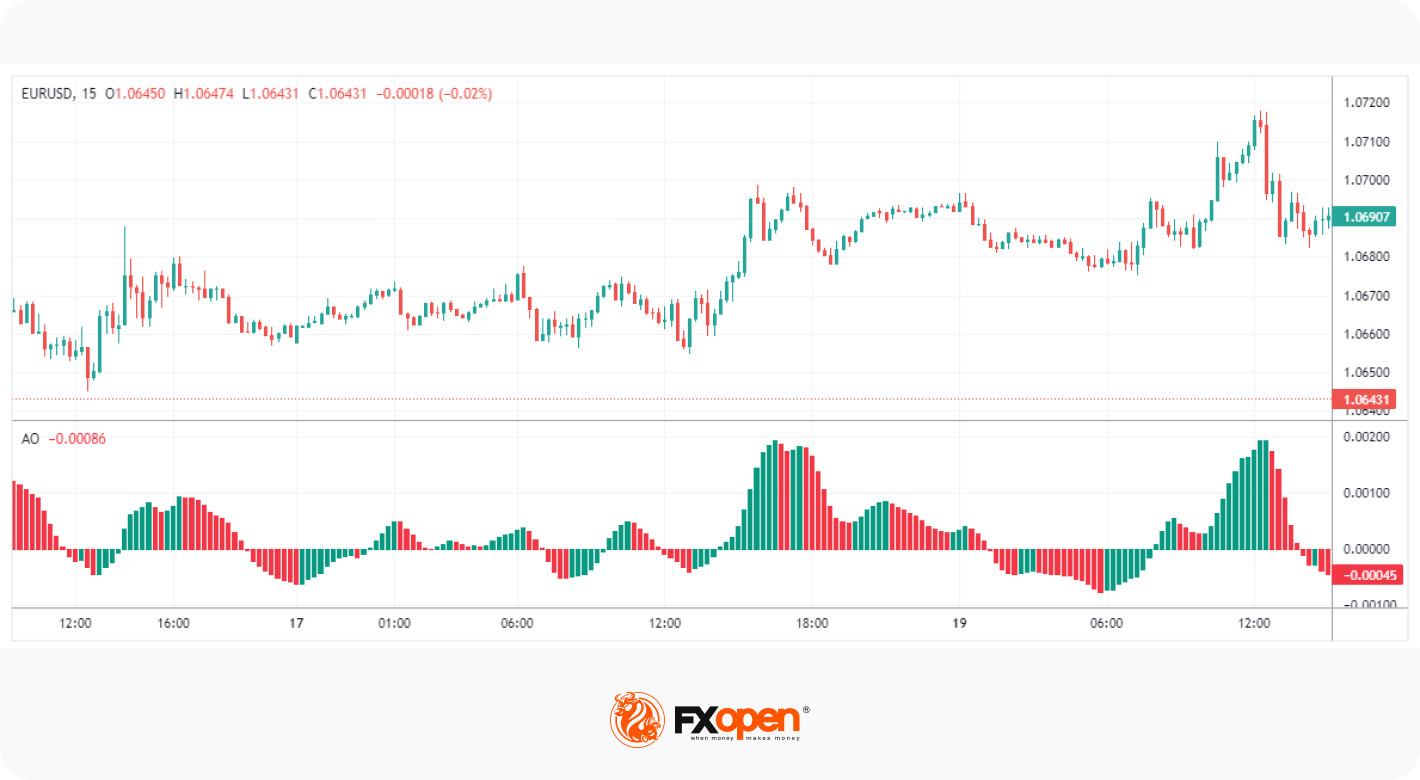
The Awesome Oscillator (AO) is a momentum indicator developed by Bill Williams to gauge market trends. It calculates the difference between a 34-period and a 5-period simple moving average (SMA), both plotted on the midpoint of a price bar ((High+Low)/2). When the AO crosses above the zero line, it typically signals bullish momentum; conversely, a move below the zero line indicates bearish momentum.
Unlike many indicators, the Awesome Oscillator generates colour-coded histograms: green for increasing momentum and red for decreasing momentum. A series of green histograms often signals a strengthening uptrend, while a sequence of red histograms suggests a developing downtrend. This makes the AO a visual and easy-to-use tool for traders who aim to time their entries and exits.
The Awesome Oscillator can be particularly useful for spotting divergences, trend reversals, and for enhancing other trading strategies. Its versatile nature makes it applicable to various asset classes, including forex, stocks, and commodities.
Awesome Oscillator Best Settings
The standard settings for the Awesome Oscillator are a 34-period and a 5-period SMA, which usually offer a balanced view of momentum. Some traders adjust these settings for a more sensitive or smoothed signal; for example, using a 14-period and 4-period SMA for quicker trades. However, tweaking the periods can lead to more false signals. Generally, adhering to the default settings is the most common strategy for a reliable interpretation of market conditions.
Below are three Awesome Oscillator trading strategies. For the best understanding, you can try applying them to real-time data in FXOpen’s free TickTrader platform.
Enhanced Saucer With RSI

The Enhanced Saucer with RSI strategy combines the saucer pattern in the Awesome Oscillator with the Relative Strength Index (RSI). In a bullish scenario, traders often look for two red histograms followed by a green one, with the AO above the zero line. Simultaneously, they seek an RSI reading above 50. Conversely, for a bearish setup, two green histograms followed by a red one are common when the AO is below the zero line, coupled with an RSI below 50.
Entry
- Traders often look for two consecutive red histograms followed by a green histogram, while AO is above the zero line and RSI is above 50 for bullish trades.
- For bearish trades, two consecutive green histograms followed by a red histogram are typical, with AO below the zero line and RSI below 50.
Stop Loss
- Stop losses are usually placed above or below a nearby swing point to limit potential losses.
Take Profit
- Profits are commonly taken at nearby support or resistance levels.
- Alternatively, traders may opt to close positions if the Awesome Oscillator crosses the zero line in the opposite direction.
This Awesome indicator strategy is favoured for its dual-indicator approach, providing an extra layer of confirmation, thus filtering out less reliable signals.
Zero-Line Crossover With Moving Average Confirmation

The Zero-Line Crossover with Moving Average Confirmation strategy is a dual-indicator approach involving the Awesome Oscillator and Exponential Moving Averages (EMAs). Here, traders often watch for a zero-line crossover on the Awesome Oscillator as an initial signal. Confirmation comes when a 9-period EMA crosses a 21-period EMA within a few candles of the zero-line crossover, either just before or shortly after.
Entry
- Traders commonly look for an AO zero-line crossover, either from below to above for a bullish setup or vice versa for a bearish setup.
- The signal is generally confirmed if a 9-period EMA crosses a 21-period EMA within close proximity of the AO event.
Stop Loss
- Stop-loss placements are generally around swing points, serving as protective barriers against adverse price movements.
Take Profit
- Take-profit levels are often determined by nearby support or resistance zones or a reverse zero-line crossover on the AO.
This strategy adds an extra layer of confirmation by incorporating EMAs, thus helping traders filter out false signals and enhance the strategy's overall reliability.
Twin Peaks Divergence

The Twin Peaks Divergence is a well-regarded Awesome Oscillator strategy focused on identifying divergences between the price and the oscillator's movements. Specifically, traders often look for two peaks on the AO histogram, above or below the zero line, that do not align with the corresponding peaks in the price chart.
Entry
- In a bullish setup, traders commonly watch for two peaks below the zero line. Entry is typically considered after two subsequent green histograms confirm the second trough.
- For bearish scenarios, two peaks above the zero line are the focus. Here, traders often wait for two red histograms to confirm the second peak before considering entry.
Stop Loss
- Protective stop-loss orders are often placed near relevant swing points.
Take Profit
- Take-profit levels are usually set at either nearby support or resistance levels.
This strategy is popular for its emphasis on divergence, offering traders an additional way to assess market conditions and potential reversals. The requirement for histogram confirmation makes it a cautious yet effective approach.
Best Practices for Using the Awesome Oscillator
When using the Awesome Oscillator for trading, certain best practices can maximise its effectiveness:
- Understanding Market Context: Before applying the AO, traders gauge the overall market trend. The indicator works best in trending markets.
- Combining Indicators: The AO pairs well with other indicators like Moving Averages or the Relative Strength Index for added confirmation.
- Using Multiple Timeframes: Checking AO readings on different timeframes can offer a more holistic view of market conditions.
The Bottom Line
In conclusion, understanding and applying the Awesome Oscillator can significantly enhance trading outcomes. It offers a versatile toolkit for gauging market momentum and spotting potential reversals. However, it’s worth remembering these strategies should be modified in accordance with a trader’s approach. To capitalise on these strategies and practise them in real time, consider opening an FXOpen account to access hundreds of tradable markets.
This article represents the opinion of the Companies operating under the FXOpen brand only. It is not to be construed as an offer, solicitation, or recommendation with respect to products and services provided by the Companies operating under the FXOpen brand, nor is it to be considered financial advice.
Stay ahead of the market!
Subscribe now to our mailing list and receive the latest market news and insights delivered directly to your inbox.


Latest articles

EUR/USD Analysis: Who Is in Control?
Two central banks, two hawkish tones — but only one dollar just took a hit. The ECB delivered a 25bp hike in June, its first since 2023, lifting the deposit rate to 2.25% as Middle East-driven energy costs pushed headline

Gold Resumes Its Advance Following the US Labour Market Report
Gold is attempting to break its medium-term trend, with the latest US labour market data acting as the main catalyst. The US employment report released on 2 July came in noticeably weaker than expected, with the pace of hiring slowing

NZD/CHF Analysis: Which Currency Breaks the Consolidation First?
NZD/CHF remains locked in a tight range as traders await the next monetary policy catalyst.
The Reserve Bank of New Zealand heads into Wednesday's meeting on shaky ground. After May's 3-3 split was resolved by a casting vote, the