


Bitcoin and Litecoin Drift Lower
FXOpen
Bitcoin and Litecoin continued the slow drift lower in the past seven days. On Thursday and Friday BTC/USD fell by close to $30 dollars, from $395.86 to a low of $366.50. Litecoin declined by 26 cents during those two days, from $3.26 to $3 dollars flat. Since then however, both cryptos have remained stable, albeit with a bearish bias. But let’s start with big brother bitcoin.
Bitcoin Falls $30 Dollars
Bitcoin’s decline of close to $30 dollars last week continues the trend lower for the cryptocurrency. We are currently quoted at $377 dollars per coin and we’ve stayed around these prices for the entire trading day. On the daily chart below we can see that despite the sharp rallies in between, the trend for BTC prices has been lower for the past few weeks.
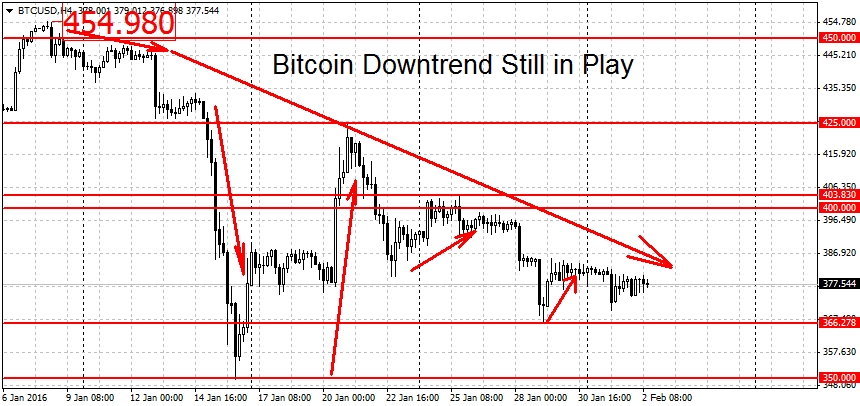
To break the bearish trend the bulls will have to stage a decisive breakout above the $403.83 swing high. However this would only put BTC/USD in neutral territory as restarting the rally requires prices above $450 dollars.
On the downside, we have some support near $366 dollars per coin. But a much stronger support level can be found at the $350 round figure. This is the January low for bitcoin and where the initial sell-off reversed course. A break below here could open the door toward the support area near $300-$310 dollars.
Litecoin Drops by 26 Cents
Litecoin dropped by 26 cents or just below 8 percent last week. Prices bounced at the $3 round figure ($3.0095 to be exact) and reversed to hit a high of $3.1239 before falling back down. We are currently trading at $3.08 dollars.
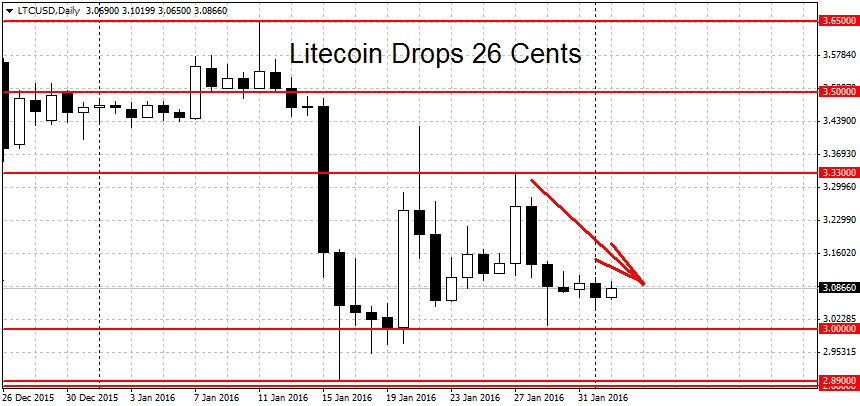
Litecoin remains in a downtrend as well. On the lower end, support can be found at the $3 dollars round figure. This is followed by a much stronger support around $2.88-$2.89 dollars per coin. This is a triple bottom formation, prices bounced off this support on three separate occasions, on October 19th, November 12th and last month on January 16th. A decisive break of this level could lead to more losses. More support on the way down can be found at $2.70 and $2.50, followed by the former swing high at $2.40 dollars and another strong support area near $2-$2.10 dollars.
To end the current downtrend, we will need to see a break above $3.33 dollars swing high. A decisive break of the $3.50 round figure could start a new LTC rally. We have more resistance higher up at $3.65 and $3.82 dollars per coin.
FXOpen offers the world's most popular cryptocurrency CFDs*, including Bitcoin and Ethereum. Floating spreads, 1:2 leverage — at your service (additional fees may apply). Open your trading account now or learn more about crypto CFD trading with FXOpen.
*Important: At FXOpen UK, Cryptocurrency trading via CFDs is only available to our Professional clients. They are not available for trading by Retail clients. To find out more information about how this may affect you, please get in touch with our team.
This article represents the opinion of the Companies operating under the FXOpen brand only. It is not to be construed as an offer, solicitation, or recommendation with respect to products and services provided by the Companies operating under the FXOpen brand, nor is it to be considered financial advice.
Stay ahead of the market!
Subscribe now to our mailing list and receive the latest market news and insights delivered directly to your inbox.


Latest articles

DAX 40: consolidation amid technology sell-off
A wave of selling in the technology sector that emerged earlier this week has weighed on European equities. The trigger was investor concern over the profitability of large-scale debt-funded investments by major US tech companies in AI infrastructure. The Nasdaq

Euro Hits Fresh Yearly Lows Amid Dovish ECB Signals
The euro remains under pressure following weak macroeconomic data from the euro area and fresh signals that the European Central Bank is prepared to maintain a more accommodative monetary policy stance. Data released yesterday pointed to a deterioration in business

Pound at Key Levels: Markets Assess Impact of Political Uncertainty in the UK
The British pound remains under pressure following increased political uncertainty in the United Kingdom triggered by the Prime Minister’s resignation. Investors are assessing potential shifts in the political and economic policy outlook after the head of government stepped down,