


Coca-Cola (KO) Share Price Drops Sharply After Earnings Report
FXOpen

On 23 October, Coca-Cola (KO) released its third-quarter earnings, which exceeded forecasts:
→ Earnings per share (EPS): Actual = $0.77; Expected = $0.74
→ Gross revenue: Actual = $11.95 billion; Expected = $11.69 billion
Despite these positive results, KO's share price saw a sharp decline, likely due to market concerns about fourth-quarter sales forecasts, which face risks associated with currency fluctuations.
Technical Analysis of Coca-Cola (KO) Stock Chart:
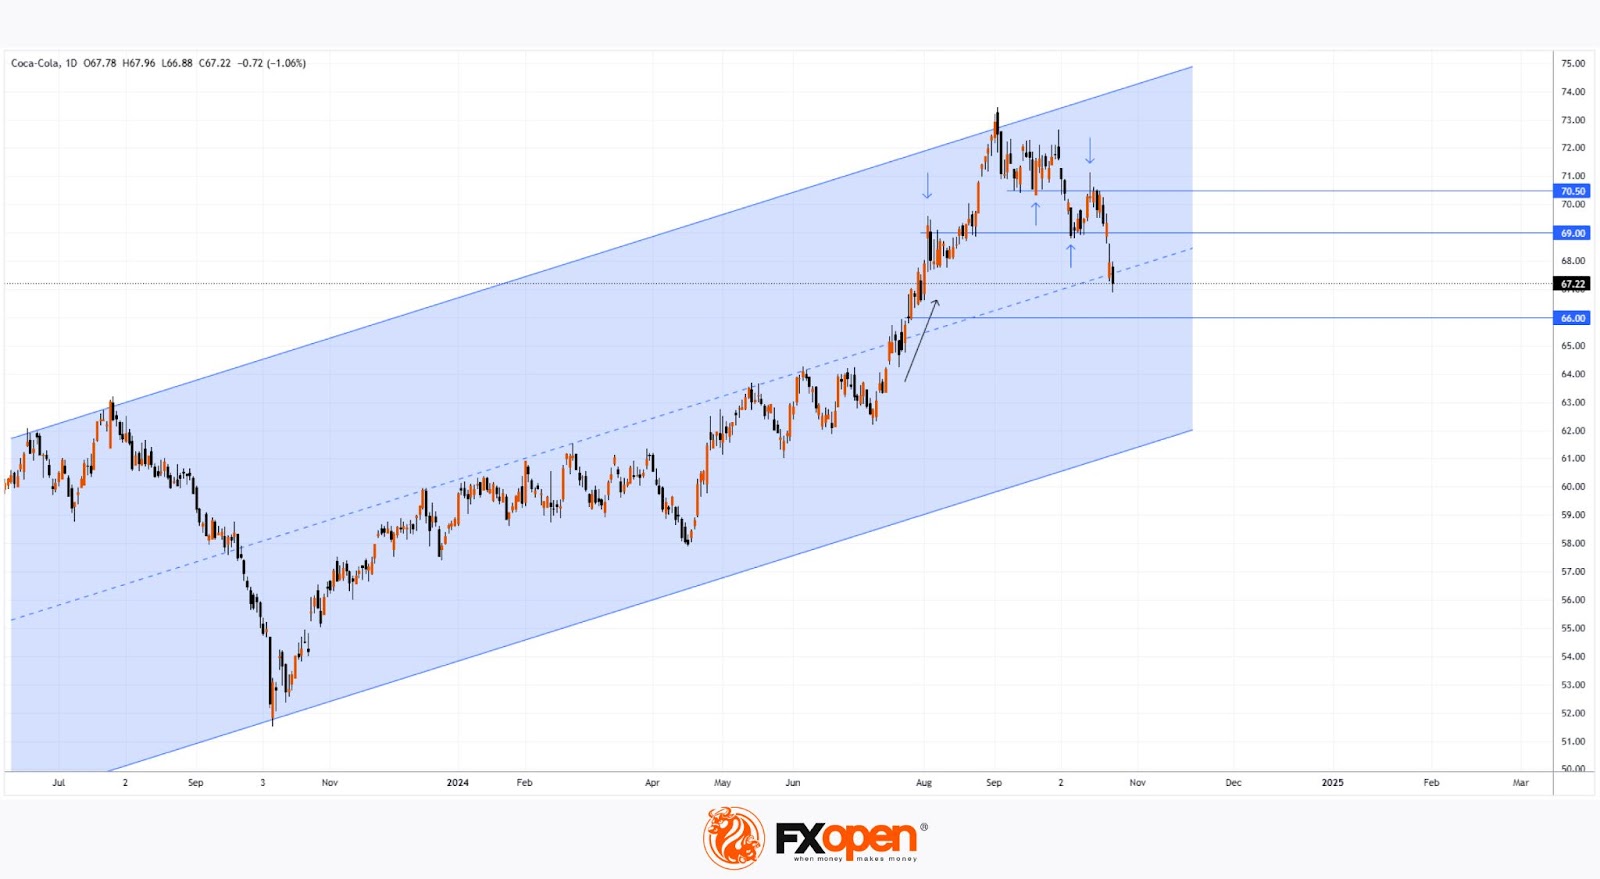
→ In 2024, price fluctuations formed an upward channel (shown in blue), with a notable surge in early August (marked by a black arrow), even as broader markets were under pressure from recession fears and the decline of the Japanese stock market. This suggests that buyer interest around the $66 level remains strong.
→ Since then, the price has oscillated between $69 and $70.50, with these levels alternately serving as support and resistance (marked by blue arrows), as well as testing the upper boundary of the blue channel.
→ Currently, KO’s price sits near the midpoint of the blue channel, indicating potential support at this level, which could significantly slow the downward momentum observed post-earnings.
Furthermore, bulls may attempt to resume the upward trend within the blue channel, with $69 acting as a key level to test the strength of demand.
Analysts remain optimistic. According to TipRanks data:
→ 11 of 15 analysts recommend buying KO stock;
→ The average KO price target is $75.46 over the next 12 months.
Buy and sell stocks of the world's biggest publicly-listed companies with CFDs on FXOpen’s trading platform. Open your FXOpen account now or learn more about trading share CFDs with FXOpen.
This article represents the opinion of the Companies operating under the FXOpen brand only. It is not to be construed as an offer, solicitation, or recommendation with respect to products and services provided by the Companies operating under the FXOpen brand, nor is it to be considered financial advice.
Stay ahead of the market!
Subscribe now to our mailing list and receive the latest market news and insights delivered directly to your inbox.


Latest articles

AUD/CAD: Months of Indecision — Is a Breakout Finally Coming?
The Australian dollar has clawed back most of its end-of-June losses, when it touched three-month lows against the greenback amid escalating Middle East tensions. Since then, sentiment has improved: the RBA's Assistant Governor Sarah Hunter signalled the board stands ready

USD/JPY: Battling at the Top of the Triangle
On 3 July, Japan's Finance Minister, Satsuki Katayama, stated that the Ministry of Finance remains in close contact with US authorities regarding developments in USD/JPY as the yen traded near its weakest level in almost 40 years. Similar verbal

Dow Jones (DJIA): Consolidation Beyond the Trend
Federal Reserve Chair Kevin Warsh testified before Congress on 14–15 July, reaffirming the Fed's commitment to bringing inflation back to target while providing no clear guidance on the future path of interest rates. Meanwhile, June inflation data came in