


FXOpen
Bitcoin prices hit a new yearly high of $583.76 today. We are currently quoted almost 8 percent higher compared to one week ago. Litecoin is again following BTC, up by 31 cents or 6.8 percent since last Tuesday.
Bitcoin Hits New Yearly Highs
Bitcoin hit another yearly high of $583.76 on FXOpen today. On other major exchanges we saw the highs of $592 and even $603 per coin. During volatile times like the past few weeks, you will see large price discrepancies between different exchanges. But as markets trade a bit calmer, arbitragers will tend to close these gaps.
For traders, it’s important to note that prices on FXOpen are less reactive and ’emotional’ compared to other exchanges. During strong rallies prices here will usually lag the market. In the past week, we saw a discount of $20-$30 below the major exchanges. But as the last few days have been somewhat slower, this gap is now down to only $8. The reverse is true during sharp declines. Here you’ll see FXOpen prices lag again, not falling as fast as other sites. During crashes you could even see the prices trade at a premium for a short period of time. The usual discount to the general BTC market is $2-$3.
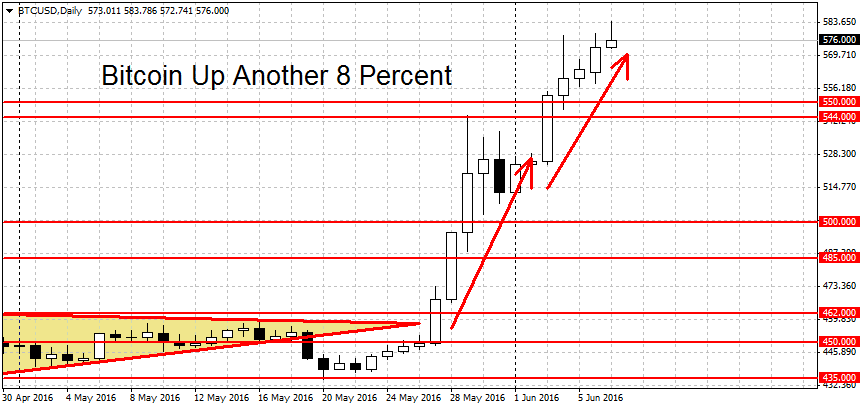
With that out of the way, let’s see how the price action looks for Bitcoin. On the chart above we can see that the uptrend is still going strong. We’re up another 8 percent this week and BTC is slowing, creeping toward the $600 round figure. All the three trends (short-term, medium-term and long-term) are pointing higher.
Above $600, resistance can be found at the July 2014 high at $654. This is followed by the $667 swing high made back in June that same year. Going further back we find more resistance at the $698 swing high and the $700 round figure.
On the downside, a support can be found at $550 (weak), $500 and $485 per coin. A decisive break below the $485 figure on FXOpen and $500 on other exchanges would end the current BTC rally.
Litecoin Follows BTC Higher
Litecoin is again following the big brother. This week, LTC is up by 31 cents to $4.85 per coin. This is exactly where we find our first resistance level, noted in our article last week.
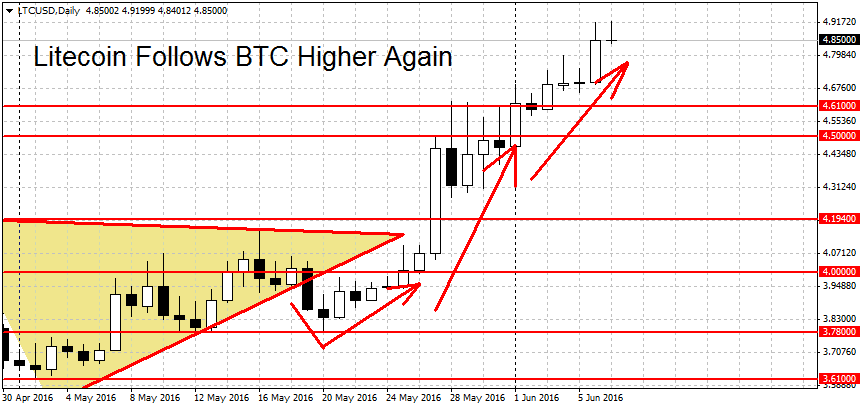
Above here we have more resistance at the round figure at $5, followed by $8.64, last year’s high for Litecoin. Due to a large gap between $5 and $8.64, some resistance levels are likely to emerge in between. Potential candidates include the round figures at $6, $7 and $8, and possibly the 50 cents figures at $6.50 and $7.50. A decisive break below $4.27 per coin would end the short-term LTC uptrend.
FXOpen offers the world's most popular cryptocurrency CFDs*, including Bitcoin and Ethereum. Floating spreads, 1:2 leverage — at your service (additional fees may apply). Open your trading account now or learn more about crypto CFD trading with FXOpen.
*Important: At FXOpen UK, Cryptocurrency trading via CFDs is only available to our Professional clients. They are not available for trading by Retail clients. To find out more information about how this may affect you, please get in touch with our team.
This article represents the opinion of the Companies operating under the FXOpen brand only. It is not to be construed as an offer, solicitation, or recommendation with respect to products and services provided by the Companies operating under the FXOpen brand, nor is it to be considered financial advice.
Stay ahead of the market!
Subscribe now to our mailing list and receive the latest market news and insights delivered directly to your inbox.


Latest articles

Market Insights with Gary Thomson: Where Are Oil, Gas & Global Indices Heading?
In this video, we’ll explore the key economic events and market trends, shaping the financial landscape. Get ready for insights into financial markets to help you navigate the week ahead. Let’s dive in!
In this episode of Market

Netflix (NFLX) Shares Pull Back After a 30% Surge
On 21 January, while analysing the NFLX chart, we:
→ identified a descending channel and a resistance zone around the $100 level;
→ noted that Netflix shares were showing a sustained downtrend. Selling pressure had been triggered primarily by reports of a

US Dollar Index (DXY) Rises Above the 100 Level
Today the US Dollar Index (DXY) climbed above the psychological 100 mark for the first time in 2026, supported by a tense fundamental backdrop, with the military conflict in the Middle East acting as the main driver.
→ Financial market participants