Bitcoin Breaks $5000, Litecoin Joins the Party
FXOpen
Bitcoin continues to make new highs. Last Thursday prices blasted through the key $5,000 level. Litecoin joined the party starting its own uptrend on the same day.
Bitcoin Breaks $5,000 Dollars
Bitcoin broke the key $5,000 round figure with easy on Thursday. During a large two-day short squeeze a new high of $5,870 dollars was hit. Since then we’ve been trading range-bound between the highs and the $5,500 level. We’re currently quoted at $5,572 dollars.
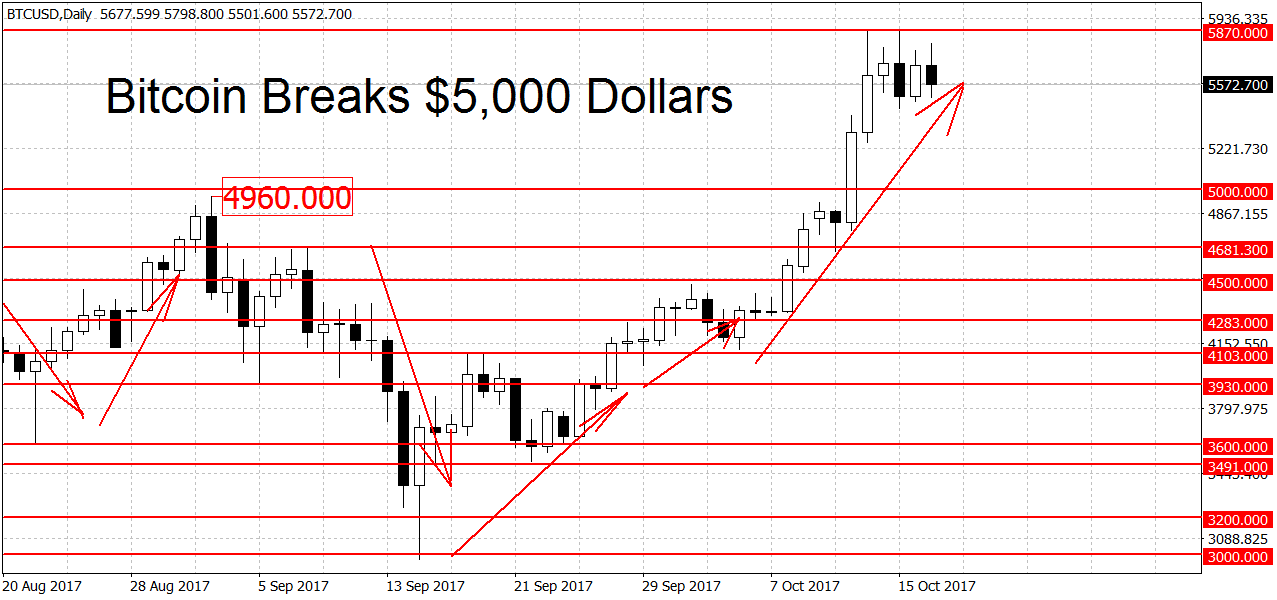
Naturally the uptrend in prices is still in play. To end it the bears will have to push BTC/USD below the $4,283 swing lows. Above here support can be found at the $4,500 round figure, followed by the $4,681 swing high and the former all-time high on FXOpen at $4,960 dollars per coin. But a much stronger support level can be found higher up at the $5,000 round figure. A decisive break of this level should be cause for worry to the bulls, although it wouldn’t technically end the rally.
Higher up we have resistance at the new all-time high of $5,870 followed by the $6,000 round figure. On the weekly and monthly charts bitcoin is looking bullish as well.
Litecoin Joins the Party
After a prolonged downtrend Litecoin finally joined big brother in an uptrend. Prices broke above the key $57.32 resistance on October 12th and proceeded to hit a high of $70.26 before stabilizing somewhat. Similarly to BTC, the last few days in LTC/USD have been mostly range-bound consolidation. Litecoin is trading at $61.14 dollars right now, over 13 percent off the recent highs.
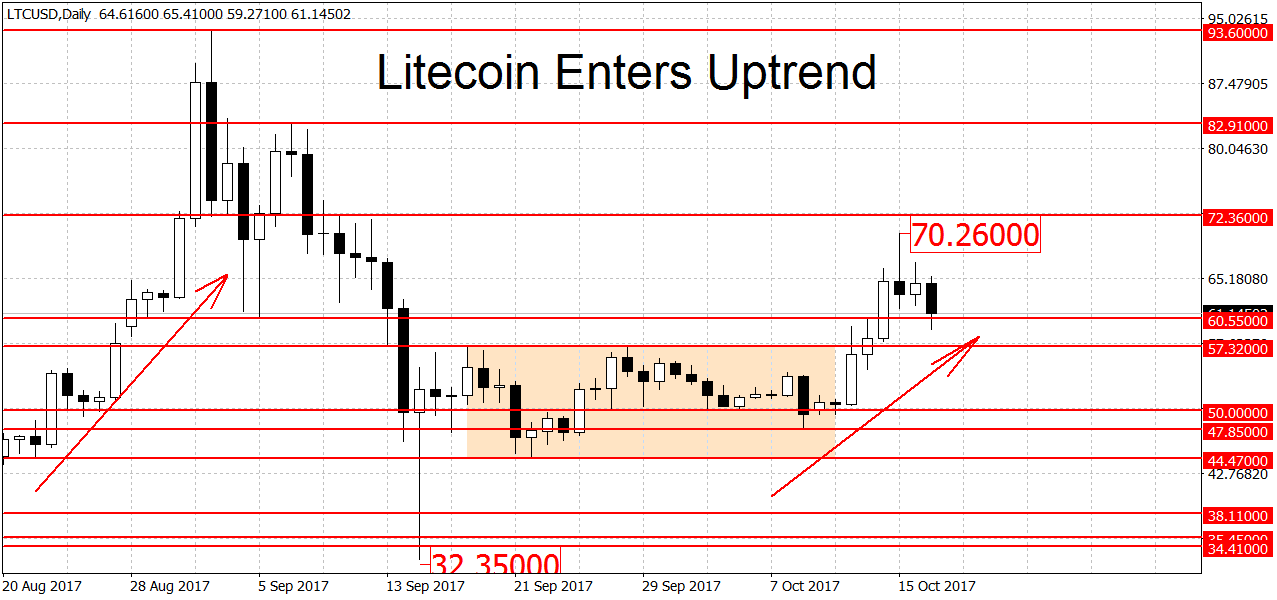
Support below here can be found at the former swing lows at $60.55. These are followed by a much stronger support level at the $57.32 breakout point. Lower still we have the $50 round figure as potential support. A break below the $47.85 dollars swing low would both end the current uptrend and start a new downtrend.
On the higher end, we find resistance near the $70 round figure at the most recent swing high of $70.26, followed by $72.36 dollars. Higher still we have a weaker level at the $80 round figure and the $82.91 swing high. On the top side we end the important levels with the all-time high at $93.60 dollars per coin. On the long-term charts we have a mixed picture. While the weekly is still range-bound, the monthly is in rally mode.
FXOpen offers the world's most popular cryptocurrency CFDs*, including Bitcoin and Ethereum. Floating spreads, 1:2 leverage — at your service (additional fees may apply). Open your trading account now or learn more about crypto CFD trading with FXOpen.
*Important: At FXOpen UK, Cryptocurrency trading via CFDs is only available to our Professional clients. They are not available for trading by Retail clients. To find out more information about how this may affect you, please get in touch with our team.
This article represents the opinion of the Companies operating under the FXOpen brand only. It is not to be construed as an offer, solicitation, or recommendation with respect to products and services provided by the Companies operating under the FXOpen brand, nor is it to be considered financial advice.
Stay ahead of the market!
Subscribe now to our mailing list and receive the latest market news and insights delivered directly to your inbox.


Latest articles


Australian Dollar Loses Momentum After May Peaks
Fundamental Background
The RBA’s third consecutive interest rate increase to 4.35% reflects the regulator’s concern over rising inflation: the conflict in the Middle East is increasing energy costs and putting upward pressure on prices. Annual consumer inflation