


BTC/USD Analysis: Bearish Arguments Become More Convincing
FXOpen

On March 18, we wrote about the activation of bears near the USD 70,000 level and the likelihood of consolidation forming near this psychological mark.
On March 25, we wrote that anxiety remains in the Bitcoin market.
Technical analysis of the BTC/USD chart with new data on the behavior of Bitcoin prices today relative to the previously designated levels and lines shows that bearish arguments are becoming more convincing:
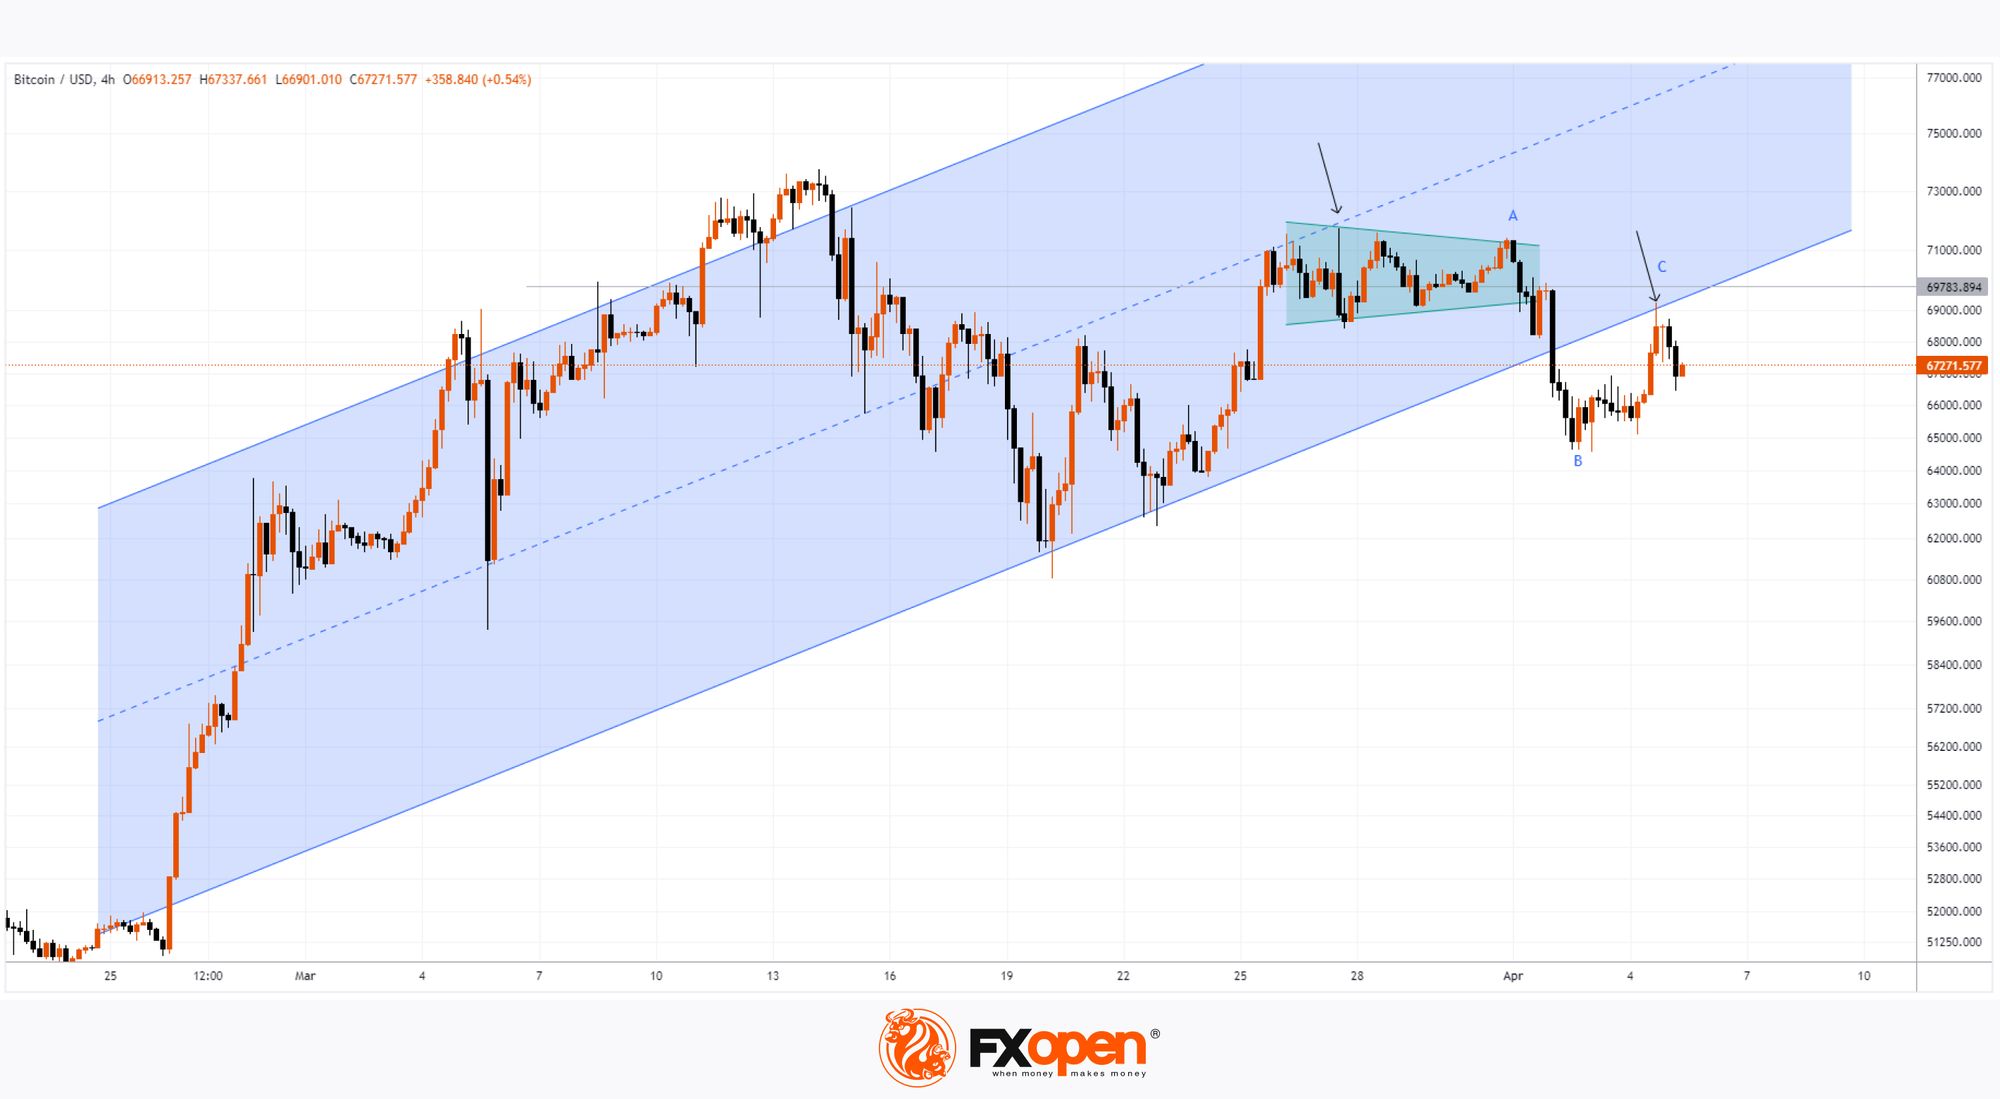
→ the median line of the ascending channel acted as resistance (shown by the first arrow);
→ the price has formed a consolidation zone (shown in green) with a subsequent bearish exit from it;
→ after a bearish breakdown of the lower border of the ascending channel, it showed signs of resistance (shown by the second arrow);
→ the increase in B→C is about 50% of the decrease in A→B, which corresponds to the proportion of the normal intermediate recovery within the dominant bearish trend.
Attempts to reach the level of USD 70k for Bitcoin in April were unsuccessful. The inability of the cryptocurrency price to demonstrate bullish dynamics is alarming due to the approaching halving, which is considered a positive factor influencing the price of Bitcoin.
It is possible that further developments will provide more turning points for building a downward channel.
FXOpen offers the world's most popular cryptocurrency CFDs*, including Bitcoin and Ethereum. Floating spreads, 1:2 leverage — at your service (additional fees may apply). Open your trading account now or learn more about crypto CFD trading with FXOpen.
*Important: At FXOpen UK, Cryptocurrency trading via CFDs is only available to our Professional clients. They are not available for trading by Retail clients. To find out more information about how this may affect you, please get in touch with our team.
This article represents the opinion of the Companies operating under the FXOpen brand only. It is not to be construed as an offer, solicitation, or recommendation with respect to products and services provided by the Companies operating under the FXOpen brand, nor is it to be considered financial advice.
Stay ahead of the market!
Subscribe now to our mailing list and receive the latest market news and insights delivered directly to your inbox.


Latest articles

Nasdaq 100: 48 Hours of Chaos, One Trendline Standing in the Way
Wall Street just lived through one of its wildest 48 hours of the year. On Wednesday, the Fed held rates steady at 3.50%-3.75%, but three FOMC members broke ranks to demand a hike—an unusually hawkish dissent

Amazon Analysis: Strong Earnings Coincide with a Breakout from the Correction
On 30 July, Amazon.com reported its financial results for the second quarter of 2026, significantly exceeding market expectations. Revenue rose 20% year-on-year to $200.6 billion, compared with the consensus forecast of around $196.5 billion. The main growth

GBP/USD and EUR/GBP Await Key Bank of England Decision
The pound strengthened following the outcome of the US Federal Reserve meeting, where the central bank, as expected, kept interest rates unchanged. However, the Fed did not provide the market with clear signals of an imminent shift towards rate cuts,