


Bitcoin Flatlines, Litecoin Still in Range
FXOpen
It’s been eight uneventful days for Bitcoin. After the surge on October 10th, BTC/USD stayed basically flat. It’s little brother Litecoin isn’t doing much better either. Prices here have been stuck in a range for the past few weeks.
Bitcoin Flatlines Above $630
Bitcoin hasn’t made much progress during the past week. We are currently quoted at $634.10, somewhat under the $642 Monday. The uptrend for BTC is still in place.
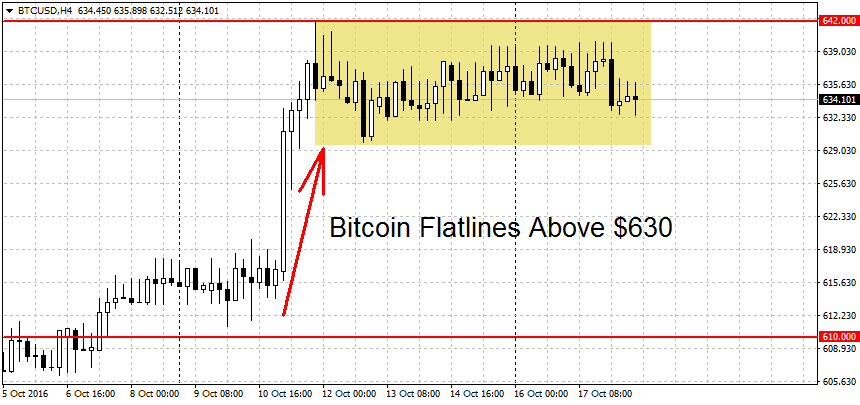
The bulls will have to make a move soon or the lack of momentum may sink prices. A decisive break of the $610 figure would end the current trend. But a move below $598 is needed to begin a new downtrend.
Weak support can be found bit lower at $590. Below here we have an area of support that starts with the $566 swing low and is followed by $556 and $550 per coin. A decisive break below $550 could lead to more losses.
Above current price we have weak resistance at last week’s high of $642. But a stronger level is the $650 round figure. This is followed by more resistance at $670 and $687. We end the near resistance levels with another round figure at $700 per coin. As noted last week, all three trends for bitcoin are now pointing upward.
Litecoin Stuck in a Range
Alternative crypto-currency Litecoin is still stuck in range. Last Wednesday the bulls tried to make a run for it. Prices rallied as high as $3.92 but the move quickly fizzled out with the hourly candle closing below the $3.90 level. Thus we didn’t get a decisive break above the figure but a brief spike that was later retraced.
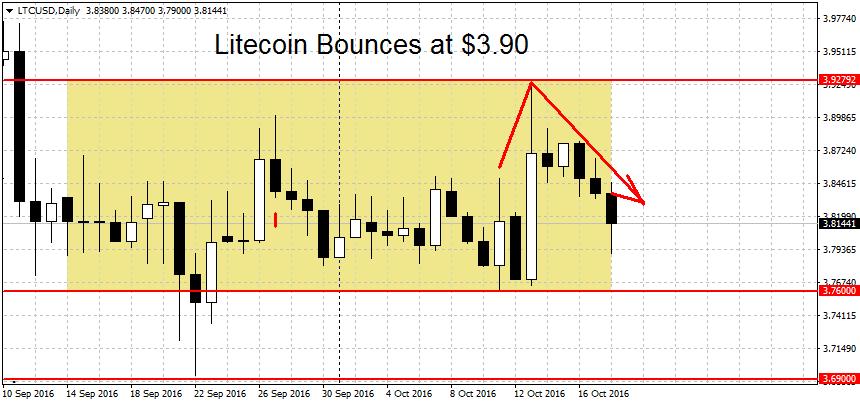
We’re now trading at $3.81 dollars per coin. A break below $3.76 may start a new trend lower. Close to here we have important support at the $3.69 swing low. This is followed by a support area from $3.50-$3.53. A clearing of this area could extend the LTC losses toward $3.22 dollars.
On the other end, a break above $3.93 could start a new uptrend for Litecoin. For extra conviction, look for a break of the $4 round figure as well. Above here we find resistance at the $4.07 swing high, followed by $4.15 and a resistance area from $4.43 to $4.52 per coin. Unlike BTC, all three trends for Litecoin (short-term, medium-term and long-term) are neutral.
FXOpen offers the world's most popular cryptocurrency CFDs*, including Bitcoin and Ethereum. Floating spreads, 1:2 leverage — at your service (additional fees may apply). Open your trading account now or learn more about crypto CFD trading with FXOpen.
*Important: At FXOpen UK, Cryptocurrency trading via CFDs is only available to our Professional clients. They are not available for trading by Retail clients. To find out more information about how this may affect you, please get in touch with our team.
This article represents the opinion of the Companies operating under the FXOpen brand only. It is not to be construed as an offer, solicitation, or recommendation with respect to products and services provided by the Companies operating under the FXOpen brand, nor is it to be considered financial advice.
Stay ahead of the market!
Subscribe now to our mailing list and receive the latest market news and insights delivered directly to your inbox.


Latest articles

US Dollar Index: A Defining Week for the King of the Markets
The dollar heads into a pivotal week trading near 101.80, just off a 15-month high, with the Fed's July 29 meeting standing as the clear focal point. Markets currently price roughly a 65% chance of a hold, though renewed

NZD/USD: Inflation Surge Meets Strong US Dollar Pressure
On 21 July, Stats NZ reported an acceleration in inflation: the Consumer Price Index rose 1.5% in the second quarter, while the annual inflation rate climbed to 4.1%, its highest level in more than two years and slightly

Weekly Market Insights with Gary Thomson: The Week of Central Banks and Earnings
In this video, we’ll explore the key economic events and market trends, shaping the financial landscape. Get ready for insights into financial markets to help you navigate the week ahead. Let’s dive in!
In this episode of Market