


Bitcoin Higher but No Trends in Sight
FXOpen
Bitcoin is trading higher today but we’re still far from declaring a new uptrend. Prices hit $420.95 early in the day before backing down somewhat. Litecoin isn’t having as good of day however. Prices are down slightly after bitcoin’s little brother erased the earlier gains.
Bitcoin Prices Hit $420.95
As noted above, BTC prices hit a high of $420.95 before easing to 417.51. We are currently quoted at $418.11, about 60 cents from the lows. On the chart below we can see that while BTC/USD had some gains in the past few days, we’ve yet to stage a brakeout.
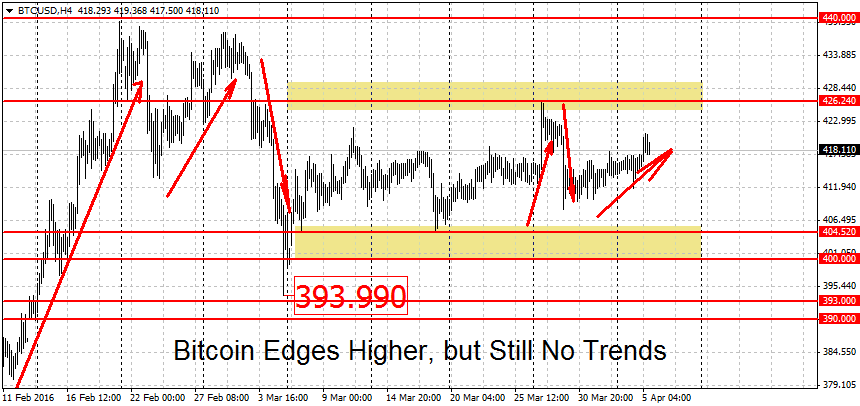
A potential level for this to occur is the latest swing high at $426.24. A decisive breakout above here may turn into a new BTC rally. Note that we’ve looking for a decisive break, not a shallow and quick piercing of the level. For the more risk-averse, maybe try the $430 dollars level. Using this level instead should cut down on the false breakouts.
Above here notable resistance levels can be found at $440 (weak), $450 and $460 dollars per coin. A clearing of this resistance area could quickly propel us toward the $500 round figure. This was the BTC high hit on most exchanges last November. A breakout above it should accelerate the gains.
On the lower end weak support can be found at the $404.52 swing low. But just like with $426, a better level may be the round $400 dollars mark. A breakdown below this level could translate into a new downtrend. At $394 we have another weak support, followed by $374 and $350 dollars per coin. A clean move below $350 may extend the losses to the support area around $300-$310 dollars.
Litecoin Slightly Down Today
Alternative crypto-currency Litecoin is trading slightly down today. After opening at $3.20 we rallied to a high of $3.23 flat, only to fall back down to $3.20 after big brother bitcoin retraced.
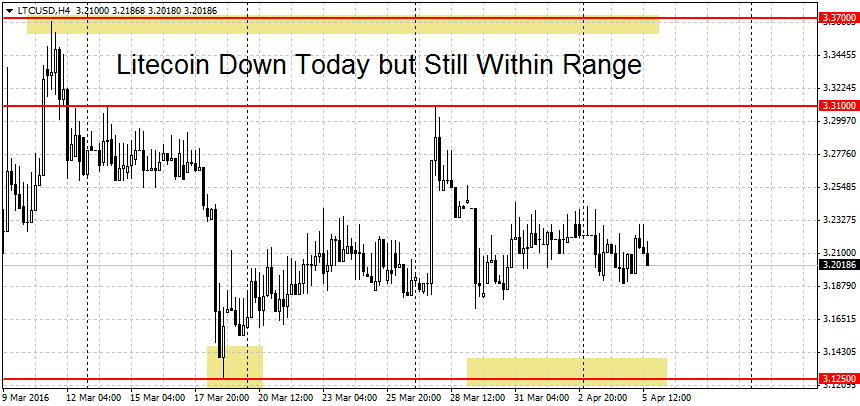
On the upside, a breakout above the $3.31 dollars swing high may turn into a new rally. Above here we find resistance at another swing high, the $3.37 dollars mark. This is followed by a major resistance is at $3.50 dollars. Higher up we have this year’s high for LTC at $3.65 dollars. We conclude the levels to the upside with the December high at $3.82 dollars and the round $4 dollars level.
While there has been some juggling in the levels higher up, not much is changed on the lower end. The important level is still $3.12 dollars per coin. A decisive break below here may start a new LTC downtrend. Below $3.12 we have support at the round $3 level, followed by a strong area of support around $2.89/$2.90 dollars. A clearing of this area may lead to more losses for Litecoin.
FXOpen offers the world's most popular cryptocurrency CFDs*, including Bitcoin and Ethereum. Floating spreads, 1:2 leverage — at your service (additional fees may apply). Open your trading account now or learn more about crypto CFD trading with FXOpen.
*Important: At FXOpen UK, Cryptocurrency trading via CFDs is only available to our Professional clients. They are not available for trading by Retail clients. To find out more information about how this may affect you, please get in touch with our team.
This article represents the opinion of the Companies operating under the FXOpen brand only. It is not to be construed as an offer, solicitation, or recommendation with respect to products and services provided by the Companies operating under the FXOpen brand, nor is it to be considered financial advice.
Stay ahead of the market!
Subscribe now to our mailing list and receive the latest market news and insights delivered directly to your inbox.


Latest articles

US Dollar Strengthens Amid Equity Market Weakness and Hawkish Fed Rhetoric
The US dollar continues to hold firm near multi-year highs as sentiment across equity markets deteriorates and investors increasingly expect the Federal Reserve to maintain a restrictive monetary policy stance for longer. The US economy remains resilient, while inflation risks

Bitcoin: Corrective Channel Broken as Traders Turn More Active
Bitcoin has come under the influence of several factors simultaneously. The wave of selling at the beginning of June was linked to Strategy's first disclosed Bitcoin sale in several years, a prolonged series of outflows from spot ETFs, and a

DAX 40: consolidation amid technology sell-off
A wave of selling in the technology sector that emerged earlier this week has weighed on European equities. The trigger was investor concern over the profitability of large-scale debt-funded investments by major US tech companies in AI infrastructure. The Nasdaq