


How to Trade Breakouts
FXOpen

Breakout trading is a common technique used by traders of all experience levels. In this article, we’ll explain what breakout trading is, offer some tips for breakout trading, and show a simple strategy a trader can use as a basis to start trading breakouts.
What Is a Breakout?
A breakout in technical analysis refers to a sustained move outside of a level of support or resistance, often characterised by high volatility. In other words, it’s where a level of support or resistance fails, causing the price of an asset to ‘break out’ and begin trending. Traders will often look to take advantage of this volatility by buying when an asset breaks above the upper trendline (resistance) or shorting when it breaks below the lower trendline (support).
Breakouts are seen following a period of consolidation, usually signified by a trading range or chart patterns like wedges, triangles, and channels. Generally speaking, breakouts typically occur in the direction of the larger trend but are also seen in market reversals, so it’s important to understand how to trade breakouts in both scenarios.
Alongside forex, commodities, and crypto*, you’ll also regularly see breakouts in stocks, meaning you can apply the tips below to whichever asset you prefer trading. While we’ll be using forex and commodities to illustrate examples of breakout trading, you’ll also find stock and crypto* CFDs on the TickTrader platform if you want to practise what you’ve learned in these markets.
Tips for Trading Breakouts in Forex and Other Markets
While trading support and resistance breakouts can be used for building effective strategies, there are some critical factors to know that may boost your chances of success.
Follow the Overall Trend
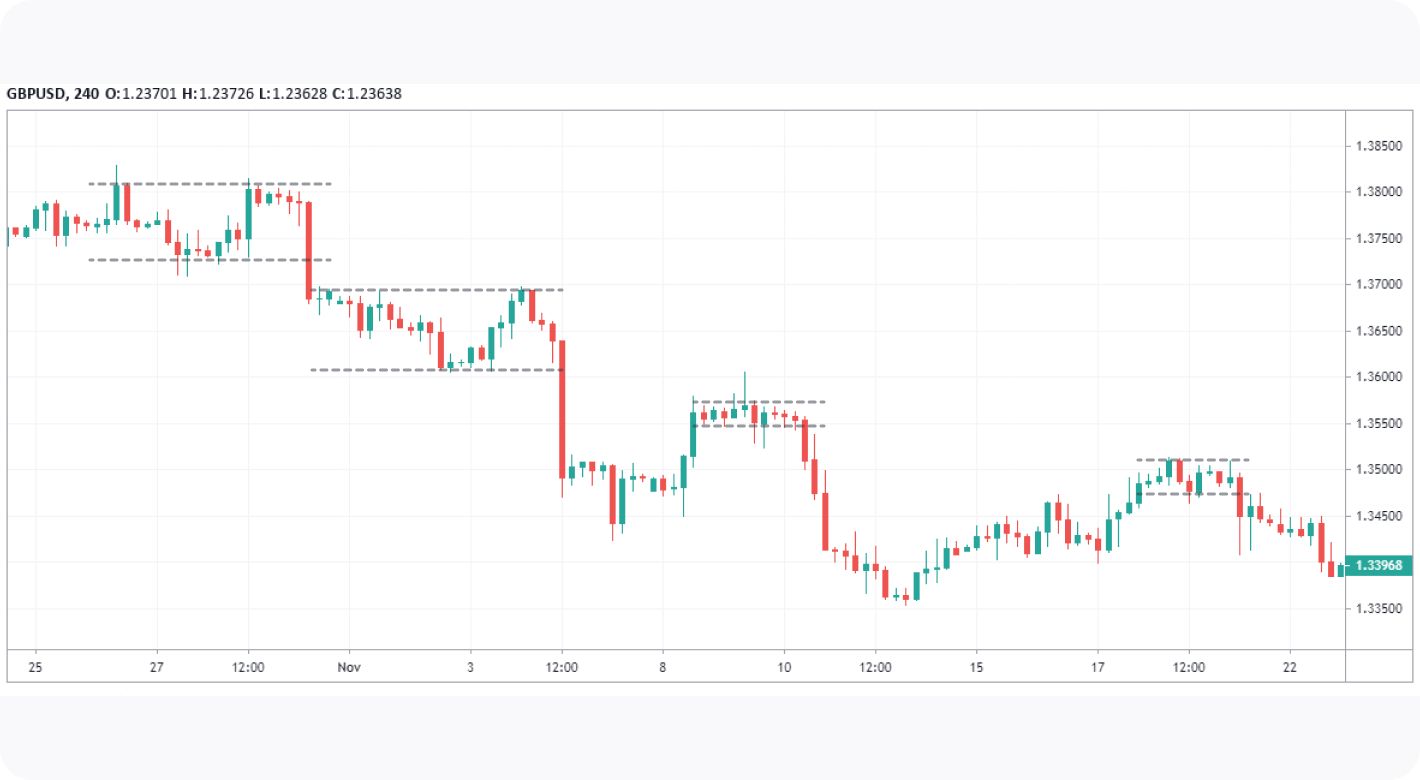
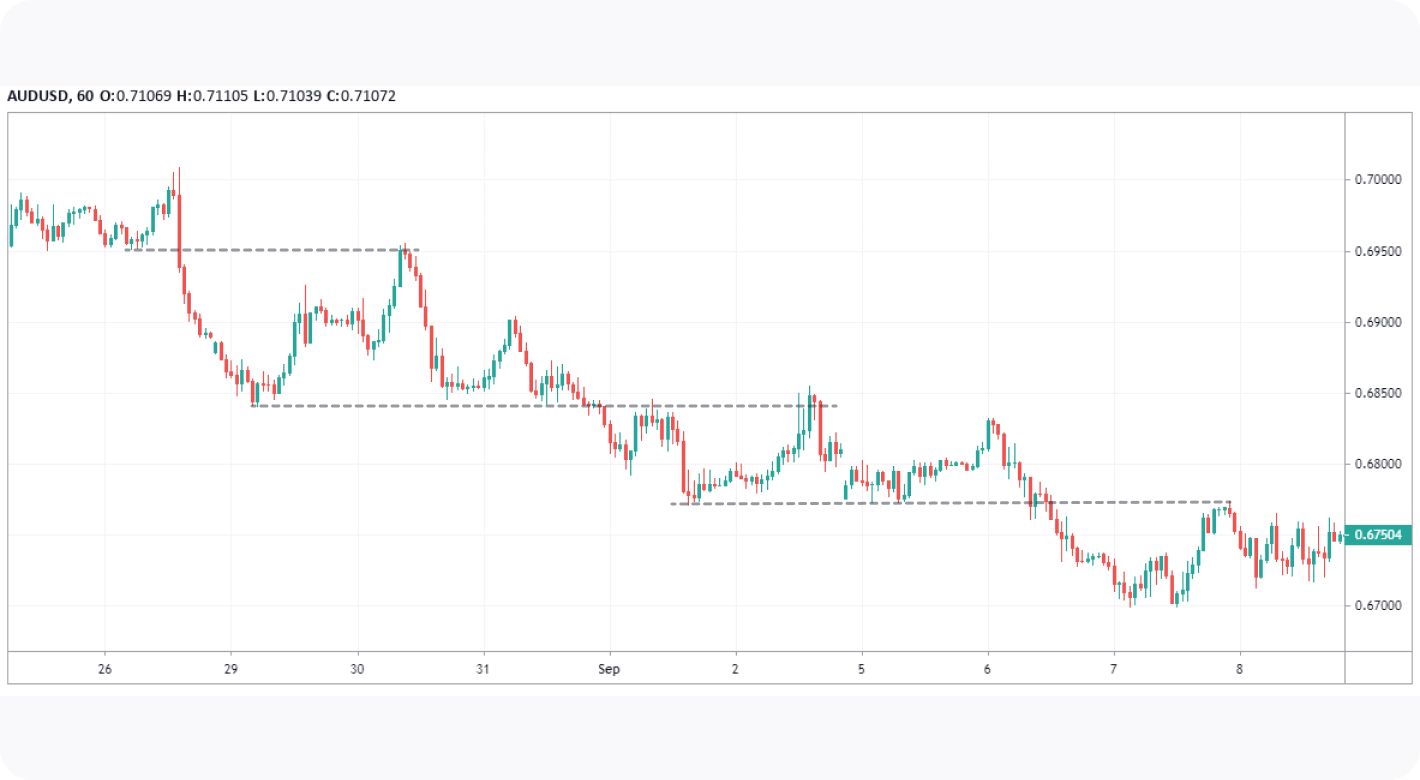
As the old maxim goes, ‘the trend is your friend’. Trends often last much longer than we expect, and while catching reversals can be satisfying, trading breakouts in the direction of an overall trend will help to improve your win rate. For example, if there’s a large bearish trend on the daily chart and a consolidation on the 4-hour or 1-hour charts, the range is much more likely to break out downwards and continue the trend.
However, there will come a point where the market reverses. One of the easiest ways to find where the market could reverse is to look for higher timeframe support and resistance levels. As the price approaches the level, we can take a more neutral stance on the market and anticipate a potential reversal.
Look for Consolidating Ranges and Chart Patterns

Alongside horizontal support and resistance, traders often use angled trendlines to help them anticipate potential breakout areas. In fact, trendlines are a fundamental component of many chart patterns that traders use to find high-probability breakout trading setups, especially channels.
The market is in constant flux between high and low volatility. In essence, breakout traders simply take advantage of high volatility following periods of low volatility. While you can use volatility-based indicators like Bollinger Bands to quickly identify areas of low volatility (signified by the Bands seeming to constrict and compress price), they’re also easily found just by looking for assets stuck in a horizontal range or chart patterns, like triangles and wedges.
Be Patient and Enter on the Retest
It can be tempting to simply buy or sell as soon as the price seemingly breaks out of a range. However, it’s not uncommon for the price to pierce through an area of support or resistance, only to quickly reverse and continue to range, or worse, hit your stop loss. These false breakouts are also known as bull or bear traps. Trying to trade every breakout you see will only lead to frustration and a lower win rate.
As with many aspects of trading, it’s best practice to look for confirmation. Traders often wait for a price to retest the level it broke out from before entering. For example, if the price breaks out below support, it will sometimes retrace bullishly and stall at the prior level of support (now acting as resistance) before continuing to move lower. You won’t always be able to enter this way, but you’ll be able to get into higher-probability setups with a tighter stop, improving your risk/reward ratio.
Trading Breakouts Strategy
So how can we use breakout setups in a forex trading strategy? There are just four key steps to getting started.
1. Find an Asset That Looks Ready to Break Out
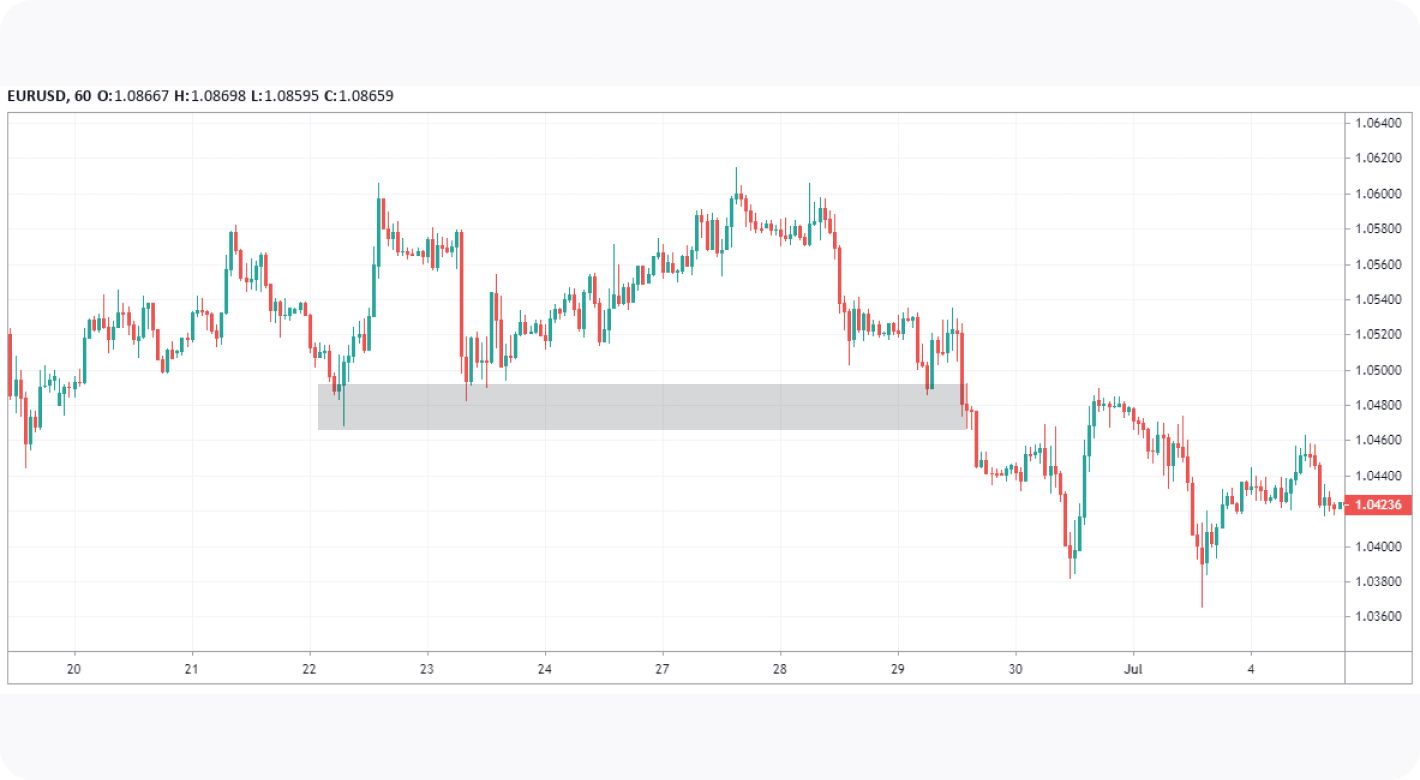
The first step is to identify an asset that is consolidating, either in a range or in a chart pattern, like a channel, triangle, wedge, or pennant. You can do this on any timeframe, but you may prefer to use the 1-hour charts and above if swing trading. If intraday trading, you may use the 15, five, or even one-minute charts.
Ideally, you’ll want to look for a price to have made multiple tests of a support or resistance area, whether a horizontal level or a trendline. This signifies that sellers or buyers are attempting to break through the respective support or resistance levels.
2. Wait for Confirmation of the Breakout and Set Your Order
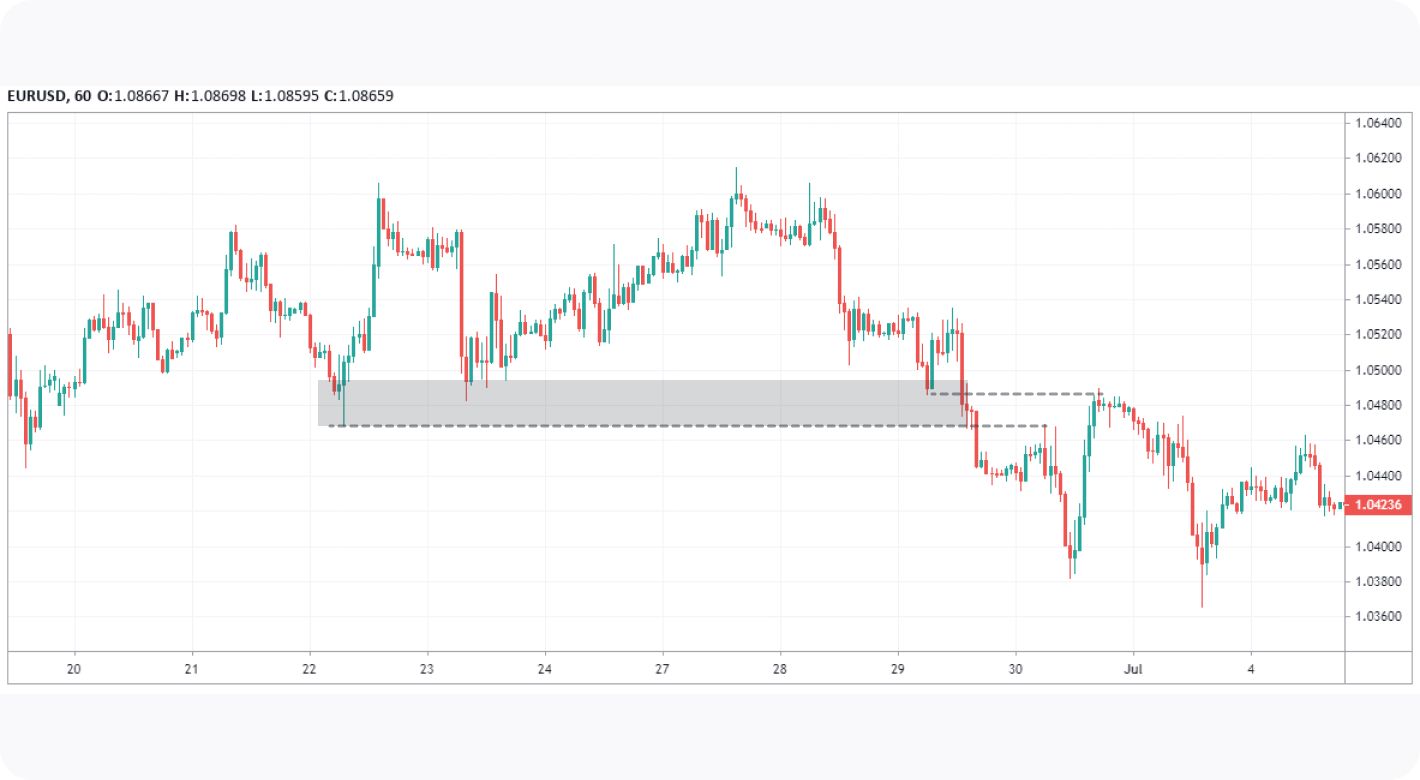
Once the level is broken and closes outside of the range or pattern for your chosen timeframe, you can set a limit order at either the most extreme swing point or the most recent swing high or swing low, which you can see in the example above.
3. Set Your Stop Loss
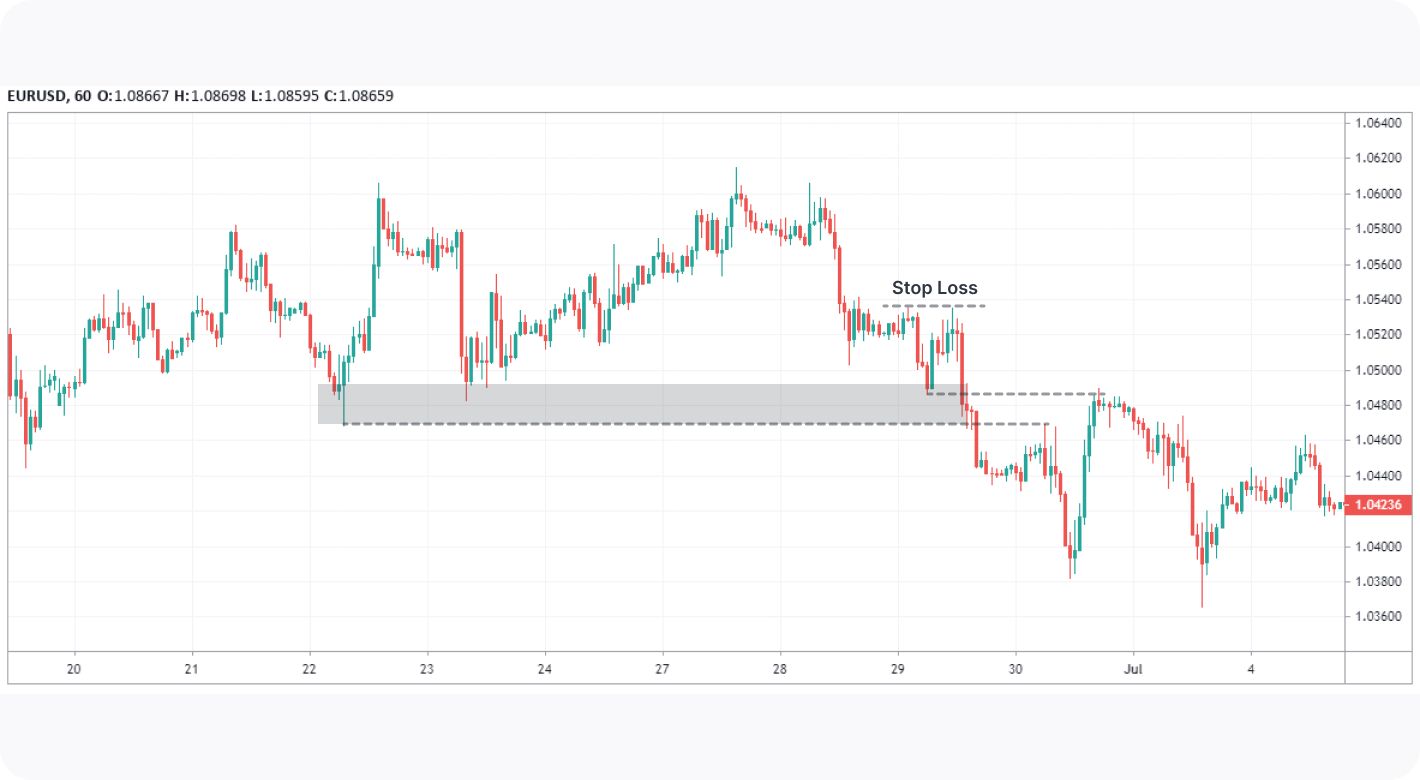
You could set a stop loss slightly above or below the area of support or resistance, but you’re more likely to be stopped out if the price retests the level with more force than expected. Instead, as demonstrated on the chart, you can try finding a nearby swing high or low to set your stop just above or below.
4. Find Your Profit Target
There are a few ways you could set a profit target here. You may choose a suitable level of risk/reward ratio, like 1:2 or 1:3, and exit your trade once you’re satisfied with your returns. You could also exit at the next significant level of support or resistance, as seen above.
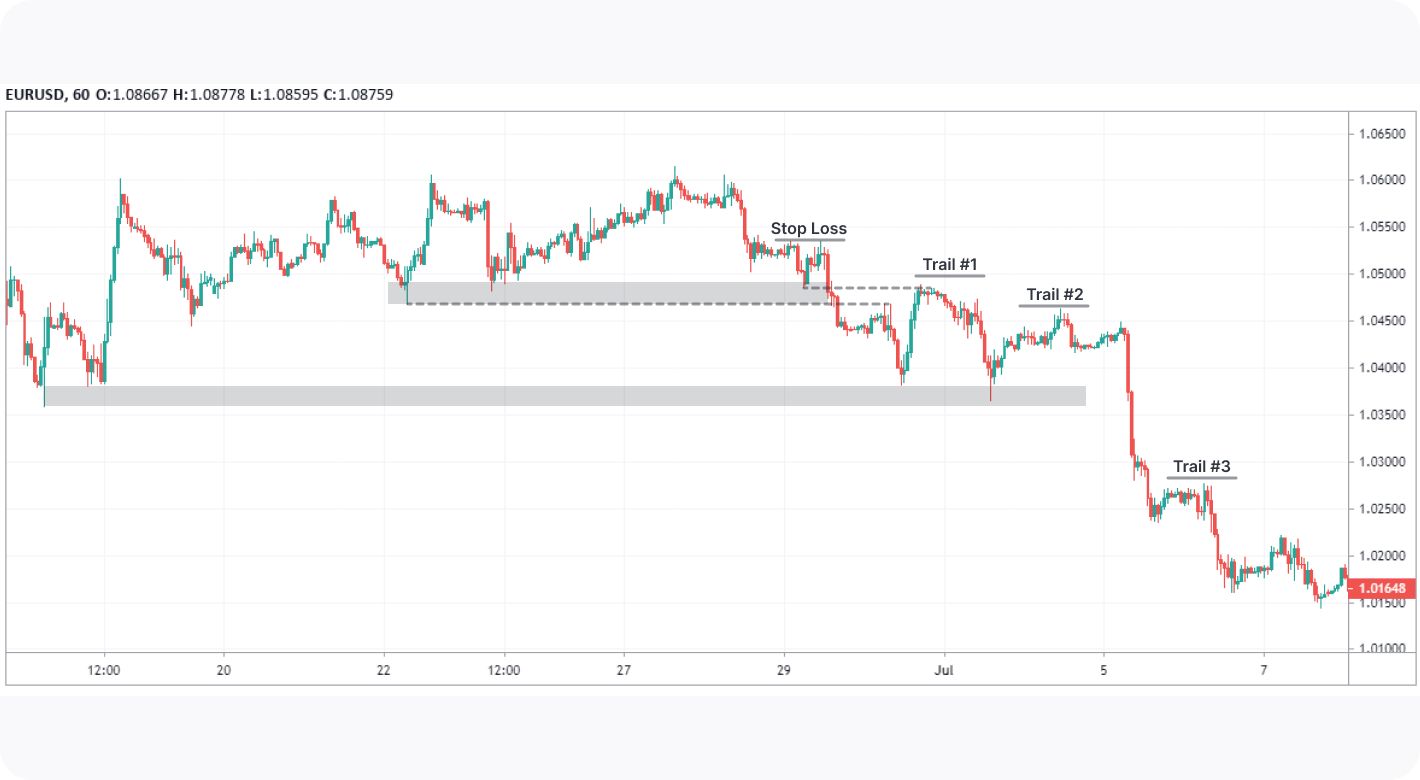
Alternatively, you may prefer to do away with setting a profit target entirely and choose to trail your stop above key swing highs or lows as the trend progresses. While this method won’t always be as successful as the example, it may be an effective way to take advantage of a strong trend.
Your Next Steps as a Breakout Trader
Wondering where to go from here? You can follow these steps if you want to grow your breakout trading skills:
- Practice identifying levels of support and resistance. You might find the TickTrader platform offered by us at FXOpen a handy tool for revisiting historical price action and plotting on charts.
- Identify common features of breakouts and note your observations.
- Once you feel you have a decent strategy, backtest it and note what worked and what didn’t.
- Continue to refine your strategy and expand your knowledge of breakout trading. Learning about pullback trading will complement your understanding.
- Feel ready to deploy your strategy in live markets? Open an FXOpen account to gain access to a wide range of assets and put your skills to the test.
*At FXOpen UK, Cryptocurrency CFDs are only available for trading by those clients categorised as Professional clients under FCA Rules. They are not available for trading by Retail clients.
This article represents the opinion of the Companies operating under the FXOpen brand only. It is not to be construed as an offer, solicitation, or recommendation with respect to products and services provided by the Companies operating under the FXOpen brand, nor is it to be considered financial advice.
Stay ahead of the market!
Subscribe now to our mailing list and receive the latest market news and insights delivered directly to your inbox.

Latest articles

GBP/USD and EUR/GBP Await Key Bank of England Decision
The pound strengthened following the outcome of the US Federal Reserve meeting, where the central bank, as expected, kept interest rates unchanged. However, the Fed did not provide the market with clear signals of an imminent shift towards rate cuts,

Microsoft Analysis: Earnings Beat Expectations
On 29 July 2026, Microsoft reported its results for the fourth quarter of fiscal year 2026. Revenue reached $90 billion, up 18% year-on-year, while adjusted earnings per share came in at $4.74, comfortably ahead of analysts' expectations of $4.

EUR/USD: All Eyes on the Fed as the Range Reaches Its Breaking Point
The dollar's next move hinges on tonight's Fed decision, and this time markets genuinely don't know what to expect. While economists still lean toward a hold—with CME FedWatch odds sitting near 68.5% for no change—Kevin Warsh's hawkish