


Bitcoin, Litecoin Take a Step Back
FXOpen

It hasn’t been a good week for bitcoin or litecoin. Big brother had a sharp retracement from $462 to $435 dollars while LTC retreated from $4.19 to $3.61 dollars per coin. After that wild ride, the past few days have been range-bound for the two major crypto-currencies.
Bitcoin Waiting for Direction
Bitcoin is waiting for its next directional move. The April move higher topped out at $462 dollars. From here we retraced to $435 dollars. Post that mini crash both BTC and LTC has been more or less unchanged. What’s next for bitcoin?
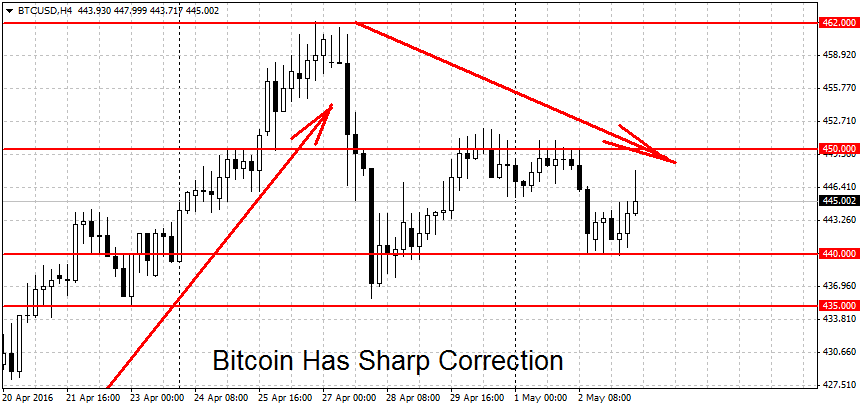
The upward momentum is gone but the trend is still up. To regain the lost momentum, the bulls will have to make a break above the $462 dollars swing high. As we’ve mentioned in previous articles we have a major resistance area from $461-$465 on Fxopen and $470-$475 on other exchanges. A decisive breakout above this important area may spark a run for the $500 round figure. This was last year’s high for BTC/USD. A break of this important level could intensify the gains.
On the other end, a clean break below the latest swing low at $435 may end the uptrend. A new trend lower requires a break below the $412 swing low as well. Some support levels below here include the round $400 figure followed by $394 dollars (weak level) and $374 dollars per coin. This year’s low for bitcoin is near the $350 round figure at $349.82. This is a potentially strong support level.
The Wright Controversy
Although likely not the reason, a potential catalyst for the sell-off was the Wright controversy. The Economist and several other major publications posted articles that the eccentric Austrian could be the creator of bitcoin. Since then however some doubts have emerged. For more on this developing story, head over to the Economist.
Litecoin Retraces Some Gains
Alternative cryptocurrency Litecoin is trading down this week. The initial spike hit $4.194 last Wednesday. From here the bears pushed prices down to $3.61. We’re currently trading at $3.71 dollars per coin.
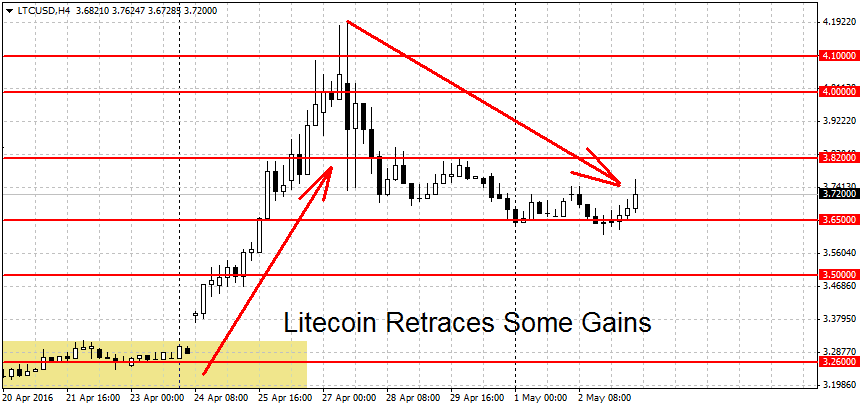
Similarly to Bitcoin, for Litecoin the trend is still bullish but with no momentum. To regain the lost momentum the bulls would need to break the $4.19 swing high. Above here we have the round $4.50 figure, followed by the former swing high at $4.85. This was the highest point for LTC/USD during the bitcoin rally back in November of last year. Higher up we have another round figure at the $5 dollars figure. From here upward there’s a large gap to the next level at $8.64 dollars per coin, last year’s high for LTC.
On the downside, a break below the breakout point at $3.26 dollars could end the current rally.
FXOpen offers the world's most popular cryptocurrency CFDs*, including Bitcoin and Ethereum. Floating spreads, 1:2 leverage — at your service (additional fees may apply). Open your trading account now or learn more about crypto CFD trading with FXOpen.
*Important: At FXOpen UK, Cryptocurrency trading via CFDs is only available to our Professional clients. They are not available for trading by Retail clients. To find out more information about how this may affect you, please get in touch with our team.
This article represents the opinion of the Companies operating under the FXOpen brand only. It is not to be construed as an offer, solicitation, or recommendation with respect to products and services provided by the Companies operating under the FXOpen brand, nor is it to be considered financial advice.
Stay ahead of the market!
Subscribe now to our mailing list and receive the latest market news and insights delivered directly to your inbox.


Latest articles

US Dollar Strengthens Amid Equity Market Weakness and Hawkish Fed Rhetoric
The US dollar continues to hold firm near multi-year highs as sentiment across equity markets deteriorates and investors increasingly expect the Federal Reserve to maintain a restrictive monetary policy stance for longer. The US economy remains resilient, while inflation risks

Bitcoin: Corrective Channel Broken as Traders Turn More Active
Bitcoin has come under the influence of several factors simultaneously. The wave of selling at the beginning of June was linked to Strategy's first disclosed Bitcoin sale in several years, a prolonged series of outflows from spot ETFs, and a

DAX 40: consolidation amid technology sell-off
A wave of selling in the technology sector that emerged earlier this week has weighed on European equities. The trigger was investor concern over the profitability of large-scale debt-funded investments by major US tech companies in AI infrastructure. The Nasdaq