


FXOpen
It’s been an uneventful week for both Bitcoin and Litecoin. Everyone’s favorite crypto-currency is down by $4 dollars or just above 0.5%. Its little brother Litecoin is down by 7 cents or 1.8 percent and is currently quoted at $3.85.
Bitcoin Hits a Roadblock
The bitcoin rally has hit a bump in the road with prices stuck around the $730 round figure. We’re now trading at $731 dollars, down by 0.54% compared to last Tuesday. On the chart below the latest 7 days of price action are shown by the second flat-lining arrow.
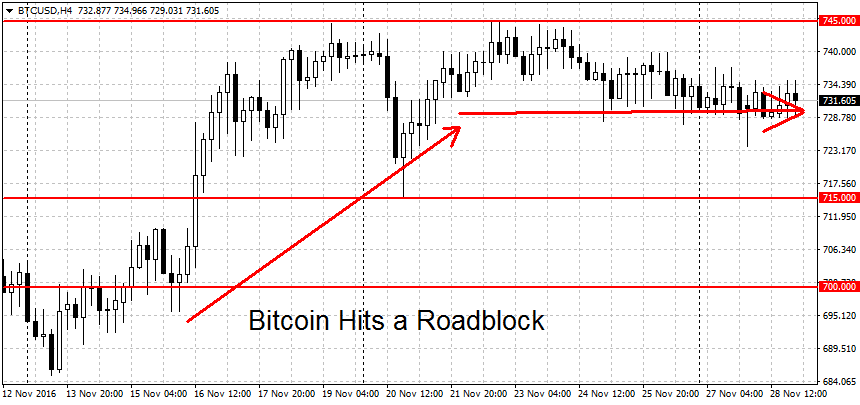
Despite the setback, the uptrend is still technically in place. To end it, the shorts will have to push prices below the $715 swing low, preferably taking out $710 as well. A new downtrend however requires a move below the $685 swing low as well. Further down support can be found at in the $671-$675 area. These are two former swing lows, a successful breakdown below here could lead to more BTC losses.
On the upper end, we have resistance at this month’s high of $744.99. This is also the yearly high for BTC/USD on Fxopen/BTC-E. But like we said last week, on other exchanges these levels are different. On BitStamp for example, we topped out this month at $755 but this year’s high was above here at $778. It’s important to keep these different levels for the exchanges in mind. The bitcoin market is decentralized, not all exchanges move in lockstep.
Litecoin Waits for Resolution
Litecoin has been a tough on trend traders this year. This has been especially the case in the past few months. Since late August, no clear trend can be seen in LTC/USD. The situation doesn’t look better on the lower time-frames either. On the chart below we can see that LTC has stayed in a tight range between $3.80 and $3.95 during most of November. In percentage terms, this is 3.8%, a relatively small amount for crypto-currencies.
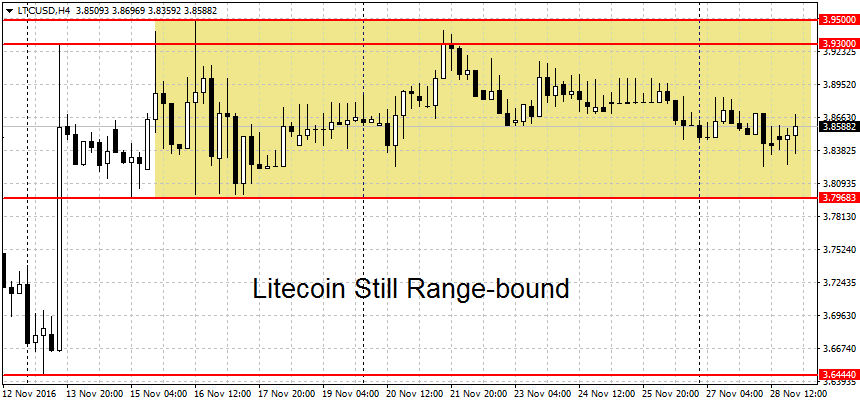
However the longer this range persists, the more odds increase that we will see a breakout higher or lower. The two important points right now are $3.95 on the upside and $3.64 on the downside. A decisive breakout beyond either of these price extremes may lead to a sustained move. Conservative traders may want to wait for a break above the $4 round figure as well. Above here we have resistance at $4.08 and $4.15 followed by a resistance area from $4.43 to $4.52 per coin.
On the lower end, if we get a break of $3.64 the next line of support is at the $3.50 round figure. This is followed by the $3.22 swing low, the $3 round figure and the $2.89 swing low. We end the levels to the downside with the 2015 August lows near $2.50 dollars per coin.
FXOpen offers the world's most popular cryptocurrency CFDs*, including Bitcoin and Ethereum. Floating spreads, 1:2 leverage — at your service (additional fees may apply). Open your trading account now or learn more about crypto CFD trading with FXOpen.
*Important: At FXOpen UK, Cryptocurrency trading via CFDs is only available to our Professional clients. They are not available for trading by Retail clients. To find out more information about how this may affect you, please get in touch with our team.
This article represents the opinion of the Companies operating under the FXOpen brand only. It is not to be construed as an offer, solicitation, or recommendation with respect to products and services provided by the Companies operating under the FXOpen brand, nor is it to be considered financial advice.
Stay ahead of the market!
Subscribe now to our mailing list and receive the latest market news and insights delivered directly to your inbox.


Latest articles

Market Insights with Gary Thomson: Where Are Oil, Gas & Global Indices Heading?
In this video, we’ll explore the key economic events and market trends, shaping the financial landscape. Get ready for insights into financial markets to help you navigate the week ahead. Let’s dive in!
In this episode of Market

Netflix (NFLX) Shares Pull Back After a 30% Surge
On 21 January, while analysing the NFLX chart, we:
→ identified a descending channel and a resistance zone around the $100 level;
→ noted that Netflix shares were showing a sustained downtrend. Selling pressure had been triggered primarily by reports of a

US Dollar Index (DXY) Rises Above the 100 Level
Today the US Dollar Index (DXY) climbed above the psychological 100 mark for the first time in 2026, supported by a tense fundamental backdrop, with the military conflict in the Middle East acting as the main driver.
→ Financial market participants