


FXOpen
It’s been a wild few days in bitcoin land, at least when compared to the previous period of calm. Prices initially spiked $11 on low volume during Easter Sunday. Today saw all those gains evaporate and then some. This pattern was repeated in LTC as well. After an inital spike to $3.30, prices are back to their starting point at $3.18 dollars per coin.
Bitcoin Spikes on Easter
As noted above, BTC/USD spiked on Easter Sunday. The move looks like a classic breakout on low volume. The false break was confirmed when prices retraced heavily today, erasing all the gains. We are currently quoted at $412.60 dollars, even below yesterday’s open at $415.50.
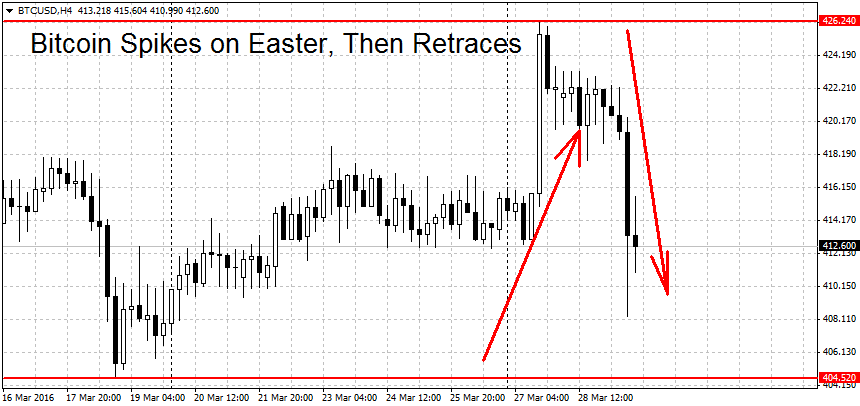
The Sunday high at $426.24 now looks like a potential breakout point. If the bulls manage to beat the bears and move prices back to here, we could see a new BTC rally. The first major resistance above here can be found at the February highs near $440 dollars per coin. Above here we have another strong resistance level at $450 dollars followed by the resistance area around $460-$470 dollars. A clearing of this area may propel prices toward last year’s high at $500 dollars.
On the other end weak support can be found at the $404.52 swing low. But the key figure on the downside could be the $400 dollars level again. A decisive break below here may renew the trend lower. Close-by we have another weak support at this month’s low of $394 dollars. More support on the way down can be found at $374 and $350 dollars. A decisive move below $350 may extend the fall toward the support area near $300-$310 dollars per coin.
Litecoin Still Range-bound
Alternative crypto-currency Litecoin is still range-bound. The coin followed pretty much the same Easter pattern as bitcoin. First we got a rally to $3.30 dollars, followed by a crash to $3.173 dollars. We are currently quoted slightly above the highs at $3.189 dollars per coin.
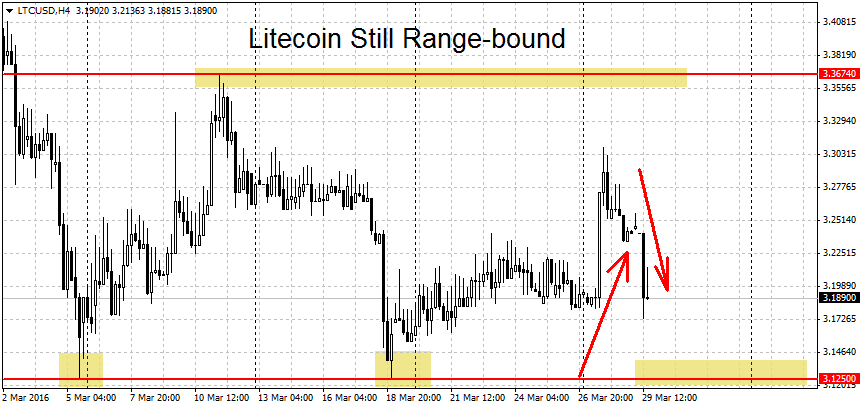
While the moves during the past few days have been slightly bigger then usual, no breakout levels have been breached yet. The important level on the lower end is still $3.12 dollars per coin. A clean move below here may start a new trend lower. The rest of the levels are more or less unchanged. Below $3.12 we have support at the round $3 level, followed by a strong area of support around $2.89/$2.90 dollars. A clearing of this area may lead to more losses toward $2.70 or $2.50 dollars per coin.
On the other side, a breakout above the $3.37 swing high could start a new LTC uptrend. Above here the first major resistance is at $3.50 dollars, followed by the $3.65 dollars swing high. Further up we have more resistance at the December highs at $3.82 dollars, followed by the round $4 dollars level.
FXOpen offers the world's most popular cryptocurrency CFDs*, including Bitcoin and Ethereum. Floating spreads, 1:2 leverage — at your service. Open your trading account now or learn more about crypto CFD trading with FXOpen.
*At FXOpen UK and FXOpen AU, Cryptocurrency CFDs are only available for trading by those clients categorised as Professional clients under FCA Rules and Professional clients under AFSL 412871 – ABN 61 143 678 719 respectively. They are not available for trading by Retail clients.
This article represents the opinion of the Companies operating under the FXOpen brand only. It is not to be construed as an offer, solicitation, or recommendation with respect to products and services provided by the Companies operating under the FXOpen brand, nor is it to be considered financial advice.
Stay ahead of the market!
Subscribe now to our mailing list and receive the latest market news and insights delivered directly to your inbox.

Latest articles

Coca-Cola (KO) Share Price Drops Sharply After Earnings Report
On 23 October, Coca-Cola (KO) released its third-quarter earnings, which exceeded forecasts:
→ Earnings per share (EPS): Actual = $0.77; Expected = $0.74
→ Gross revenue: Actual = $11.95 billion; Expected = $11.69 billion
Despite these positive results, KO's share price saw

ETH/BTC Hits 44-Month Low
The ETH/BTC exchange rate has reached its lowest level in 44 months, as shown on the ETH/BTC chart, indicating that in 2024, cryptocurrency investors seem to favour Bitcoin over Ethereum.
The downward trend, shown by the red channel,

What Is a Doji Candle, and How Can You Use It in Trading?
A Doji candle is a technical analysis tool reflecting the uncertainties in the market. Although it provides strong signals, it should be used with other patterns or technical indicators. Why do traders look for Dojis when trading stocks, commodities, and