


FXOpen
After lingering below the recent highs for almost a month, Bitcoin finally broke the $465 resistance level on Friday. In the next two days, the $500 round figure gave way as well, marking a high of $544 on Sunday. Litecoin faithfully following BTC so far is up by 11.5 percent since Friday.
Bitcoin Surges 17 Percent
Everyone’s favorite cryptocurrency surged 17 percent in the past few days alone. After clearing the important $462 – $465 resistance level (noted HERE), BTC hit $495 by Saturday and $544.58 on Sunday. The $465 resistance help up prices for the past few months, so it’s not a surprise that bitcoin went out of control once the level was finally broken. As expected, a similar spike happened on a break of $500, last year’s high for BTC/USD on most exchanges.
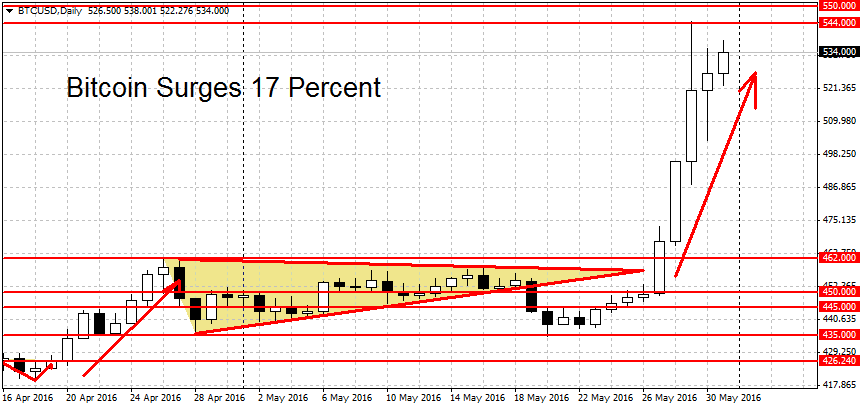
With the most recent upmove, the long-term trend is now bullish as well. The short-term and medium-term trends have been flashing buys on/off for the past several weeks. All the three major trends are in agreement now.
What’s next for Bitcoin? After the large gains we’ve been stuck in retracement for the past two days. The prices have ranged between a low of $503 and a high at $538. Still even here the bullish bias is apparent as the prices are now quoted at $534, much closer to the highs then the lows.
A notable resistance level above here includes the new yearly high at $544.58, followed by the round figures at $550 and $600 per coin. Higher up, the July 2014 high at $654 may act as a resistance, followed by the $667 swing high made back in June that same year. Going further back we find more resistance at the $698 swing high and the $700 round figure.
On the downside, a support can be found at $500 and $465 per coin. A decisive break below the $450 level would end the current BTC rally.
Litecoin Follows BTC Higher
Alternative cryptocurrency Litecoin is following BTC higher. We’re now up by 11 percent compared to Bitcoin’s 17%. For LTC/USD, the short-term and medium-term trends are up but the long-term trend is still neutral.
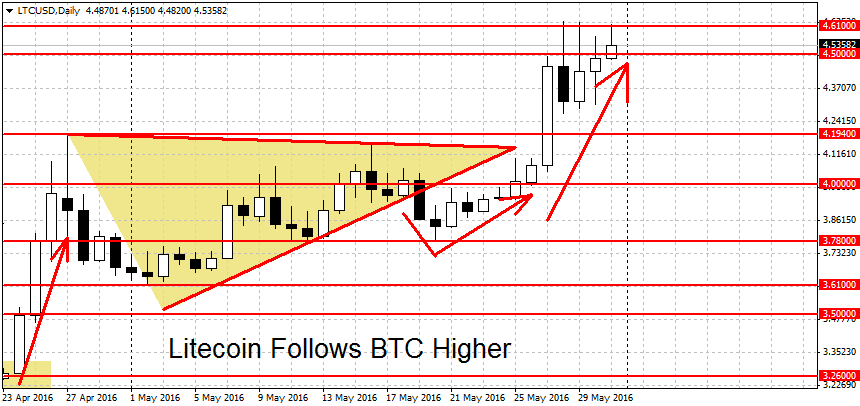
With the prices quoted at $4.53 right now, support can be found at the round $4.50 figure and the $4.195 swing high. Resistance becomes support and this former lid on prices may now act to support them. The uptrend could end on a decisive break below the $3.78 swing low.
On the upside, prices have been testing $4.62 – $4.63 for the past few days. A clean breakout above here could extend the move toward the the $4.85 swing high. The next potential resistance level is at the round figure at $5, followed by $8.64, last year’s high for Litecoin. As I’ve previously written, due to a large price gap between $5 and $8.64, thr resistance levels are likely to emerge in between. Potential candidates include the round figures at $6, $7 and $8, as well as the 50 cents figures at $6.50 and $7.50 per coin.
FXOpen offers the world's most popular cryptocurrency CFDs*, including Bitcoin and Ethereum. Floating spreads, 1:2 leverage — at your service. Open your trading account now or learn more about crypto CFD trading with FXOpen.
*At FXOpen UK and FXOpen AU, Cryptocurrency CFDs are only available for trading by those clients categorised as Professional clients under FCA Rules and Professional clients under AFSL 412871 – ABN 61 143 678 719 respectively. They are not available for trading by Retail clients.
This article represents the opinion of the Companies operating under the FXOpen brand only. It is not to be construed as an offer, solicitation, or recommendation with respect to products and services provided by the Companies operating under the FXOpen brand, nor is it to be considered financial advice.
Stay ahead of the market!
Subscribe now to our mailing list and receive the latest market news and insights delivered directly to your inbox.

Latest articles

Coca-Cola (KO) Share Price Drops Sharply After Earnings Report
On 23 October, Coca-Cola (KO) released its third-quarter earnings, which exceeded forecasts:
→ Earnings per share (EPS): Actual = $0.77; Expected = $0.74
→ Gross revenue: Actual = $11.95 billion; Expected = $11.69 billion
Despite these positive results, KO's share price saw
ETH/BTC Hits 44-Month Low
The ETH/BTC exchange rate has reached its lowest level in 44 months, as shown on the ETH/BTC chart, indicating that in 2024, cryptocurrency investors seem to favour Bitcoin over Ethereum.
The downward trend, shown by the red channel,

What Is a Doji Candle, and How Can You Use It in Trading?
A Doji candle is a technical analysis tool reflecting the uncertainties in the market. Although it provides strong signals, it should be used with other patterns or technical indicators. Why do traders look for Dojis when trading stocks, commodities, and