


BTC and XRP - Bullish breakout seen
FXOpen

BTC/USD
The price of Bitcoin has risen by 2.37% from yesterday’s low at $9163 coming to $9380 at its highest point today. The price is now being traded around those levels and is still in an upward trajectory.
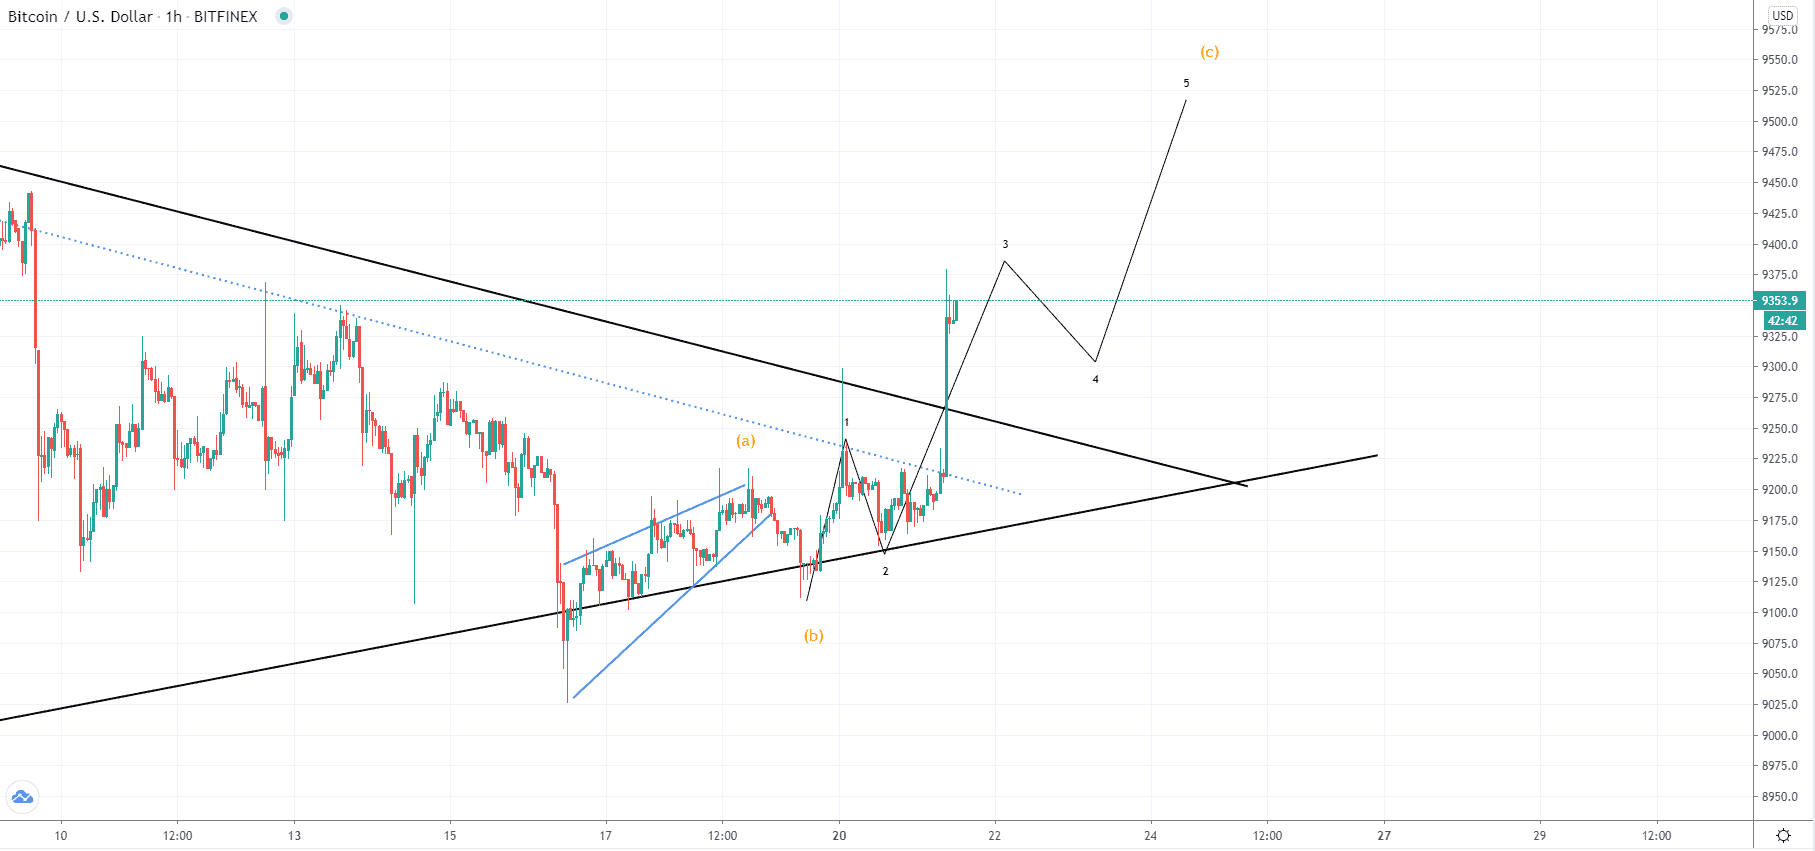 Looking at the hourly chart, you can see that a breakout has been made from the symmetrical triangle in which the price was bouncing from the 1st of June which a highly significant breakout. But there is yet to see confirmation as the price managed to move above it several times and its resistance levels haven’t been that much respected. This is why now we are most likely to see a move to the downside as a retracement back to some of the broken resistance levels for a retest of support before the upward trajectory would continue.
Prior to this spikey increase, we have seen the formation of the ascending triangle which appears to be a leading diagonal and is most likely the 1st wave of the higher degree impulse or the A wave from another ABC to the upside. In both cases, further upside movement would be expected from here as the impulsive move is to develop fully but if we have seen a proper breakout then the now labeled A wave would be the 1st out of the higher degree count which indicates that the price is headed for a sustainable uptrend in the upcoming weeks.
XRP/USD
The price of Ripple has made an increase from yesterday’s low at $0.19433 of around 3.12% as it came up to $0.2 mark today. At the moment the price is being traded slightly lower and is showing signs of weakness but overall is still in an upward trajectory.
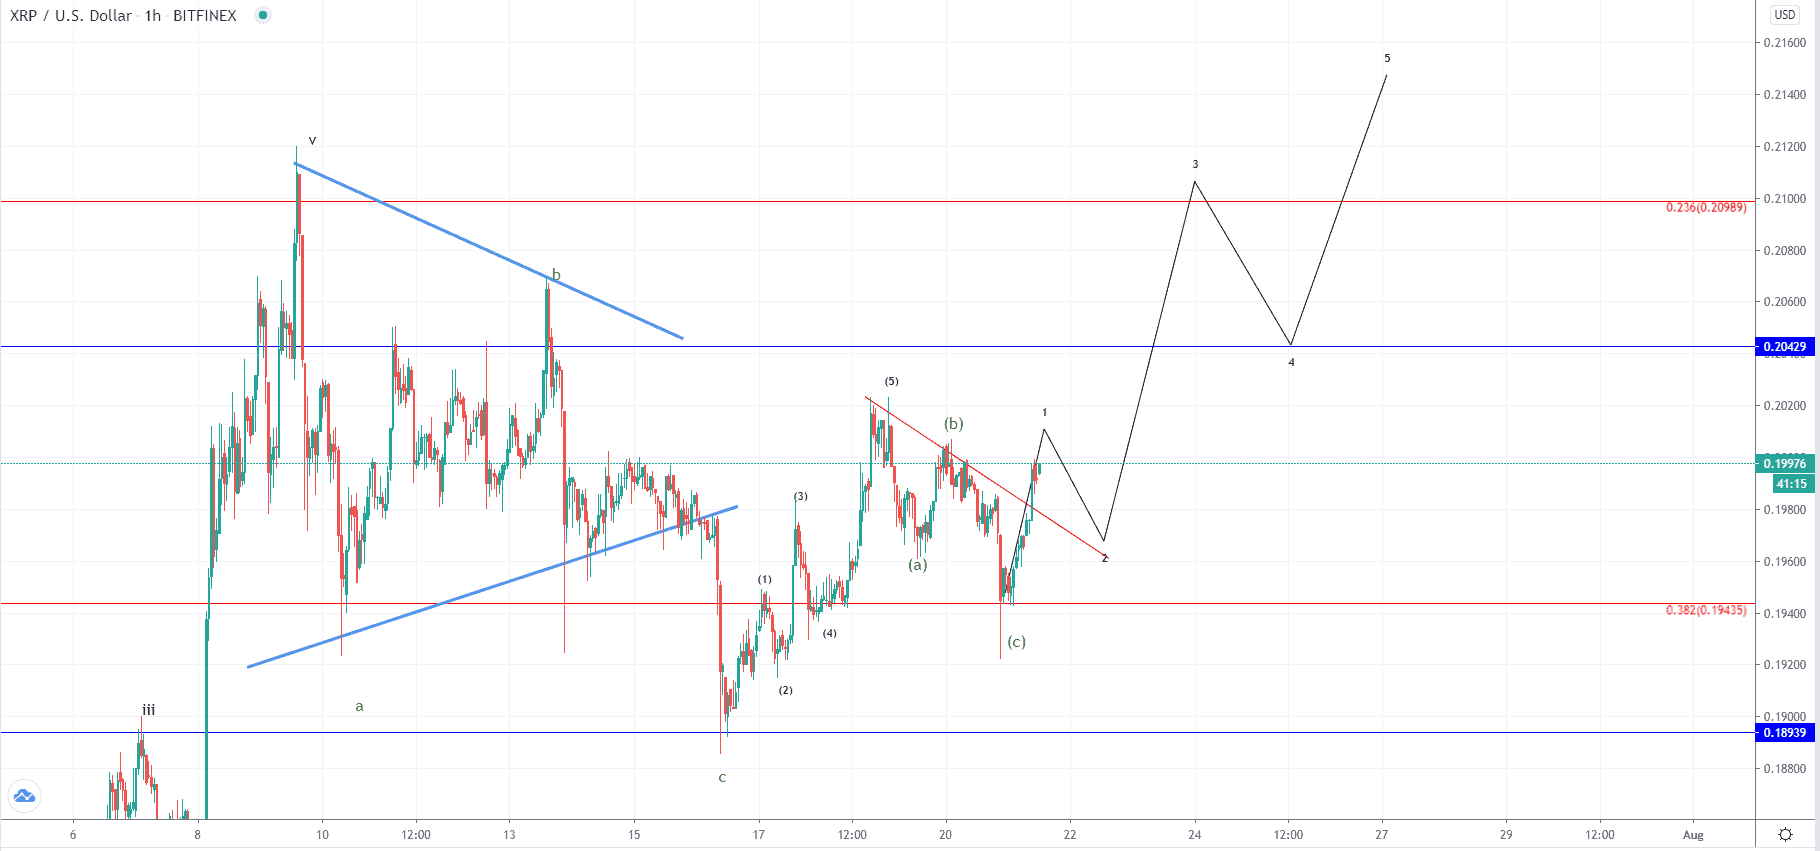 On the hourly chart, you can see that the price started breaking out from the minor descending trendline which was made from the 18th of July but came to the next one which started forming since the 9th of July when the price came up above $0.21 level and started a higher degree ABC to the downside. Now as the correction appears to be over and we have seen the first 12345 impulse wave with a lower degree three-wave retracement the move to the upside seen from yesterday is most likely the start of the next impulse of a lower degree which would be the 3rd wave of a higher degree count.
If this is true then the price of ripple is headed for a higher high compared to the one made on the 9th of July and is even headed likely even higher as another 5th wave of a higher degree should develop after another retracement.
FXOpen offers the world's most popular cryptocurrency CFDs*, including Bitcoin and Ethereum. Floating spreads, 1:2 leverage — at your service (additional fees may apply). Open your trading account now or learn more about crypto CFD trading with FXOpen.
*Important: At FXOpen UK, Cryptocurrency trading via CFDs is only available to our Professional clients. They are not available for trading by Retail clients. To find out more information about how this may affect you, please get in touch with our team.
This article represents the opinion of the Companies operating under the FXOpen brand only. It is not to be construed as an offer, solicitation, or recommendation with respect to products and services provided by the Companies operating under the FXOpen brand, nor is it to be considered financial advice.
Stay ahead of the market!
Subscribe now to our mailing list and receive the latest market news and insights delivered directly to your inbox.


Latest articles

Weekly Market Insights with Gary Thomson: The Week of Central Banks and Earnings
In this video, we’ll explore the key economic events and market trends, shaping the financial landscape. Get ready for insights into financial markets to help you navigate the week ahead. Let’s dive in!
In this episode of Market

Intel at a Crossroads: Earnings Beat Meets Technical Resistance
Intel has just delivered its strongest quarter in over fifteen years, and the market reaction says it all. Q2 2026 revenue surged 25% year-over-year to $16.1 billion, crushing the consensus estimate of $14.42 billion, while adjusted EPS of

Tesla: Complex Range Structure Breaks Down Following Quarterly Earnings
Tesla released its Q2 2026 results after the market closed on 22 July. Revenue increased 26% year-on-year to $28.24 billion, while vehicle deliveries reached a record 480,126 units. However, operating margin fell sharply to 1.4%, down from