


BTC and XRP - Bullish momentum seen
FXOpen
The price of Bitcoin has been moving sideways from the 10th of April when it came up again to the significant $59,420 level where it found resistance. We are now seeing a breakout from the minor triangle formed on Saturday with the price increasing by around 5% measured from its lowest point on Monday.
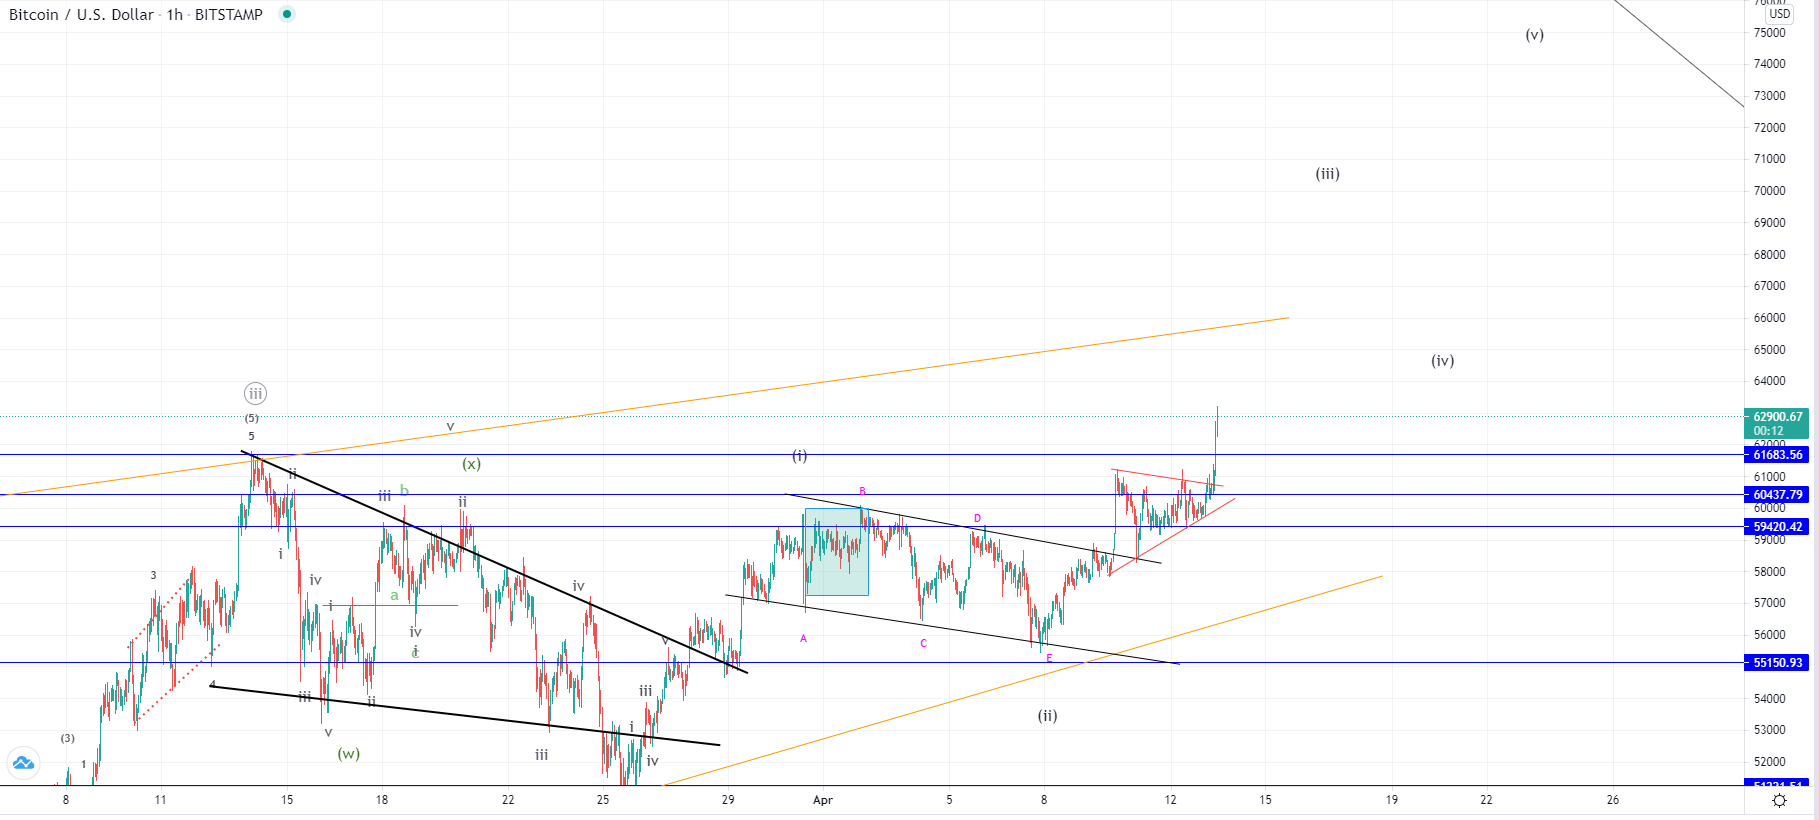
We can see that this breakout made a new all-time high on the hourly chart as an increase was made past the horizontal resistance at the $61,000 area. The momentum is looking strong which is why further upside continuation would be expected.
If this is the next wave from the five-wave impulse that started on the 25th of March, we could see significantly higher price levels before completing this upside movement. This is the assumed 3rd wave which would be the strongest one and is projected to go above the ascending trendline from the triangle that formed from the 21st of February. But first, interaction with the ascending trendline would be expected from which we are going to see if this count is valid.
Another possibility would be that this is another three-wave increase in the ending diagonal pattern, after which the price would end its bullish momentum but for now the primary could is a positive one.
XRP/USD
The price of Ripple has continued increasing from last week and came up from $0.857 at its lowest point to $0.1656 where its currently sitting which is an increase of 93.13%. It is still in an upward trajectory and is making new high with each rise.
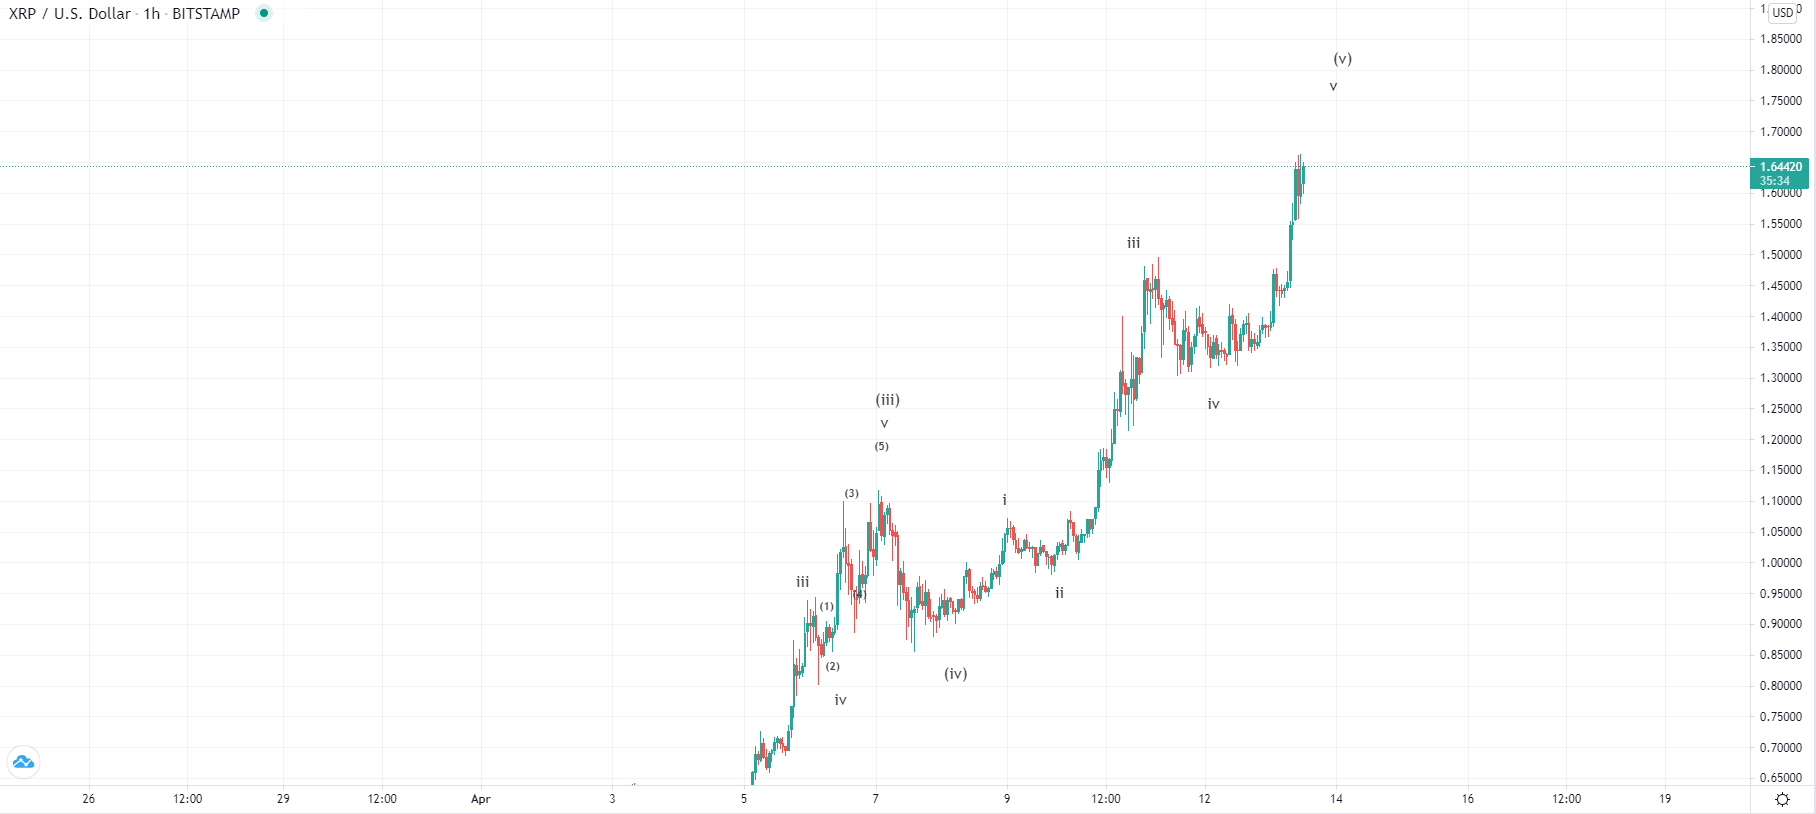
On the hourly chart, you can see that the price of Ripple is in its ending wave out of the next five-wave impulse to the upside which is why shortly the move would be expected to ends. Also considering that the price has been on the rise without a major correction from last week we could now see the higher degree descending move to somewhere around the $1 mark. However, the price has still more upside potential, and this swing alone but also on a bigger scale which is why further highs would be expected eventually.
The price of Ripple could be set to surpass its all-time high as the majority of the altcoins already have but it is still unclear how this is to play out.
This forecast represents FXOpen Markets Limited opinion only, it should not be construed as an offer, invitation or recommendation in respect to FXOpen Markets Limited products and services or as financial advice. Cryptocurrency CFDs are not available to trade in all jurisdictions.
FXOpen offers the world's most popular cryptocurrency CFDs*, including Bitcoin and Ethereum. Floating spreads, 1:2 leverage — at your service (additional fees may apply). Open your trading account now or learn more about crypto CFD trading with FXOpen.
*Important: At FXOpen UK, Cryptocurrency trading via CFDs is only available to our Professional clients. They are not available for trading by Retail clients. To find out more information about how this may affect you, please get in touch with our team.
This article represents the opinion of the Companies operating under the FXOpen brand only. It is not to be construed as an offer, solicitation, or recommendation with respect to products and services provided by the Companies operating under the FXOpen brand, nor is it to be considered financial advice.
Stay ahead of the market!
Subscribe now to our mailing list and receive the latest market news and insights delivered directly to your inbox.


Latest articles

US Dollar Strengthens Amid Equity Market Weakness and Hawkish Fed Rhetoric
The US dollar continues to hold firm near multi-year highs as sentiment across equity markets deteriorates and investors increasingly expect the Federal Reserve to maintain a restrictive monetary policy stance for longer. The US economy remains resilient, while inflation risks

Bitcoin: Corrective Channel Broken as Traders Turn More Active
Bitcoin has come under the influence of several factors simultaneously. The wave of selling at the beginning of June was linked to Strategy's first disclosed Bitcoin sale in several years, a prolonged series of outflows from spot ETFs, and a

DAX 40: consolidation amid technology sell-off
A wave of selling in the technology sector that emerged earlier this week has weighed on European equities. The trigger was investor concern over the profitability of large-scale debt-funded investments by major US tech companies in AI infrastructure. The Nasdaq