


BTC and XRP - Lower lows expected
FXOpen
BTC/USD
On Sunday the price of Bitcoin has spiked to the upside reaching $7192 at its highest point. Since then we have seen an impulsive decrease below the point from which the previous increase starting with the price coming down to $6625 at it’s lowest point which was a decrease of 7.88% made yesterday. From there we have seen an increase of 4.37% at it’s highest point today as the price came to retest the $6914 horizontal level. 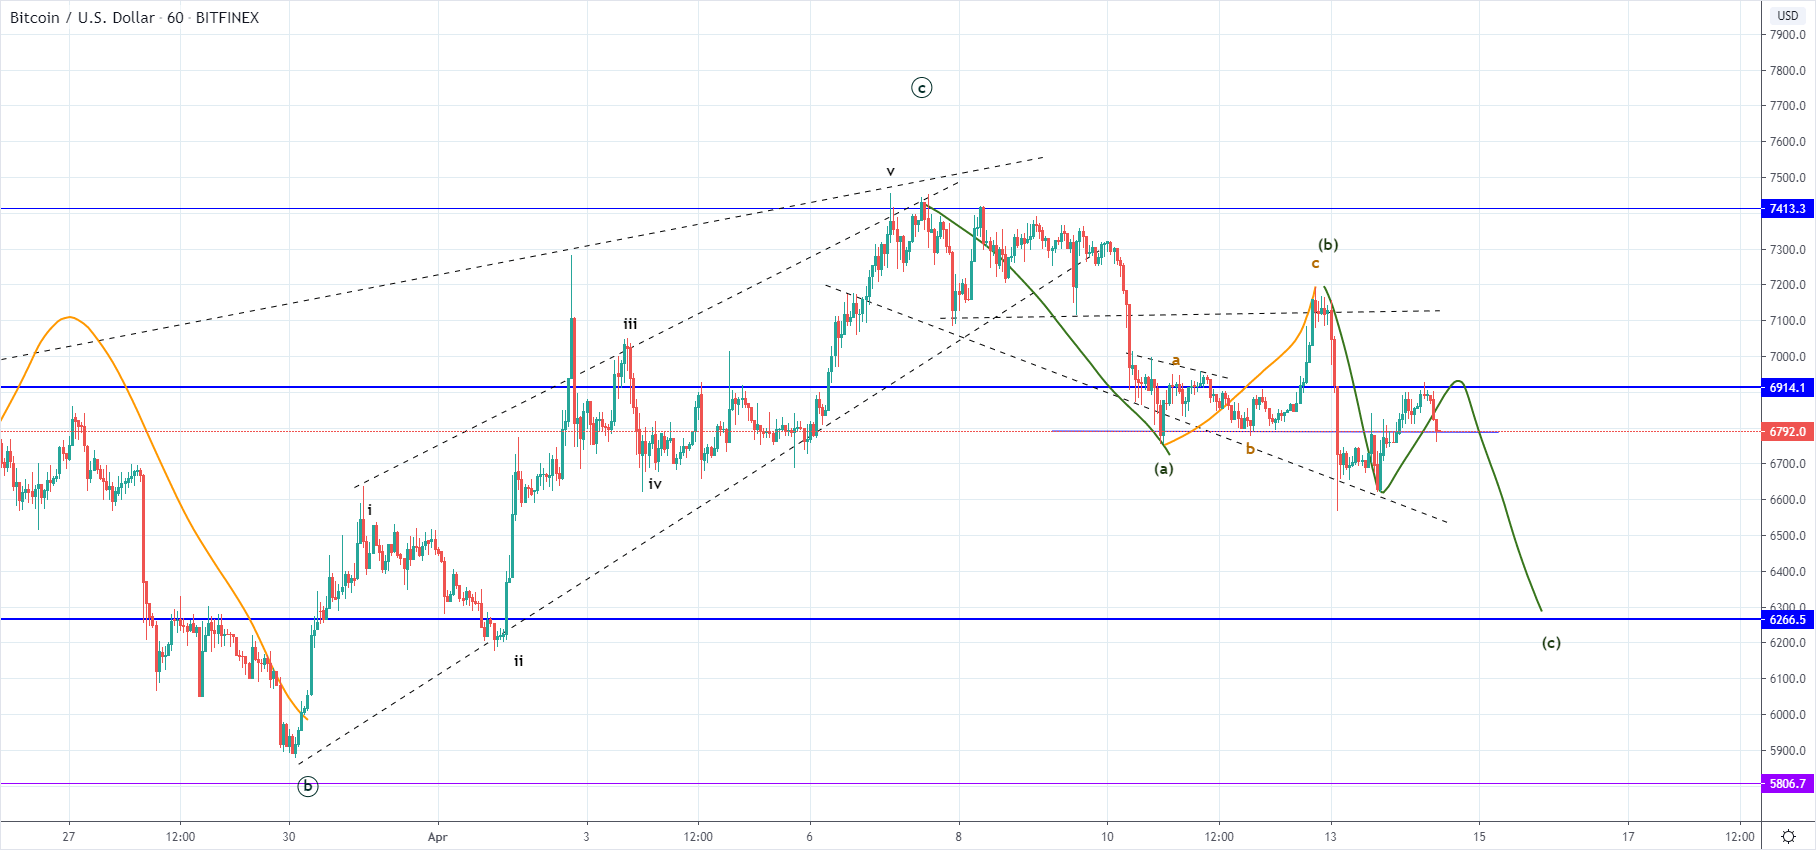 As the price experienced rejection it was set of in a downward trajectory again and is currently sitting around the levels of the minor horizontal level at $6792. Looking at the wave structure we can see that the first two waves to the downside have been completed after a five-wave move to the upside in an ascending channel ended which is presumed to be the completion of the C wave of a higher degree.
This means that not from the $7413 level we are seeing the start of either an impulsive move to the downside in a five-wave manner or another ABC correction in a three-wave manner. The first structure could be the first impulse wave or the A wave as both are subdivided into five waves, and with the corrective increase that followed coming to retest the 1st sub-waves ending point it could be the 2nd wave of a higher degree.
In either way not a 3rd structure to the downside would be expected to develop which is to lead the price of Bitcoin below it’s prior low, and potentially to the next significant horizontal level at $6266.
XRP/USD
From Sunday’s high at $0.19574 the price of Ripple has fallen by 7.32% to the weekly low at $0.1814 made yesterday but from there made a 4% recovery coming to $0.1893 at it’s highest point today. Currently, the price is being traded at $0.1856 and is in a downward trajectory but is showing sign of buyer’s pressure.
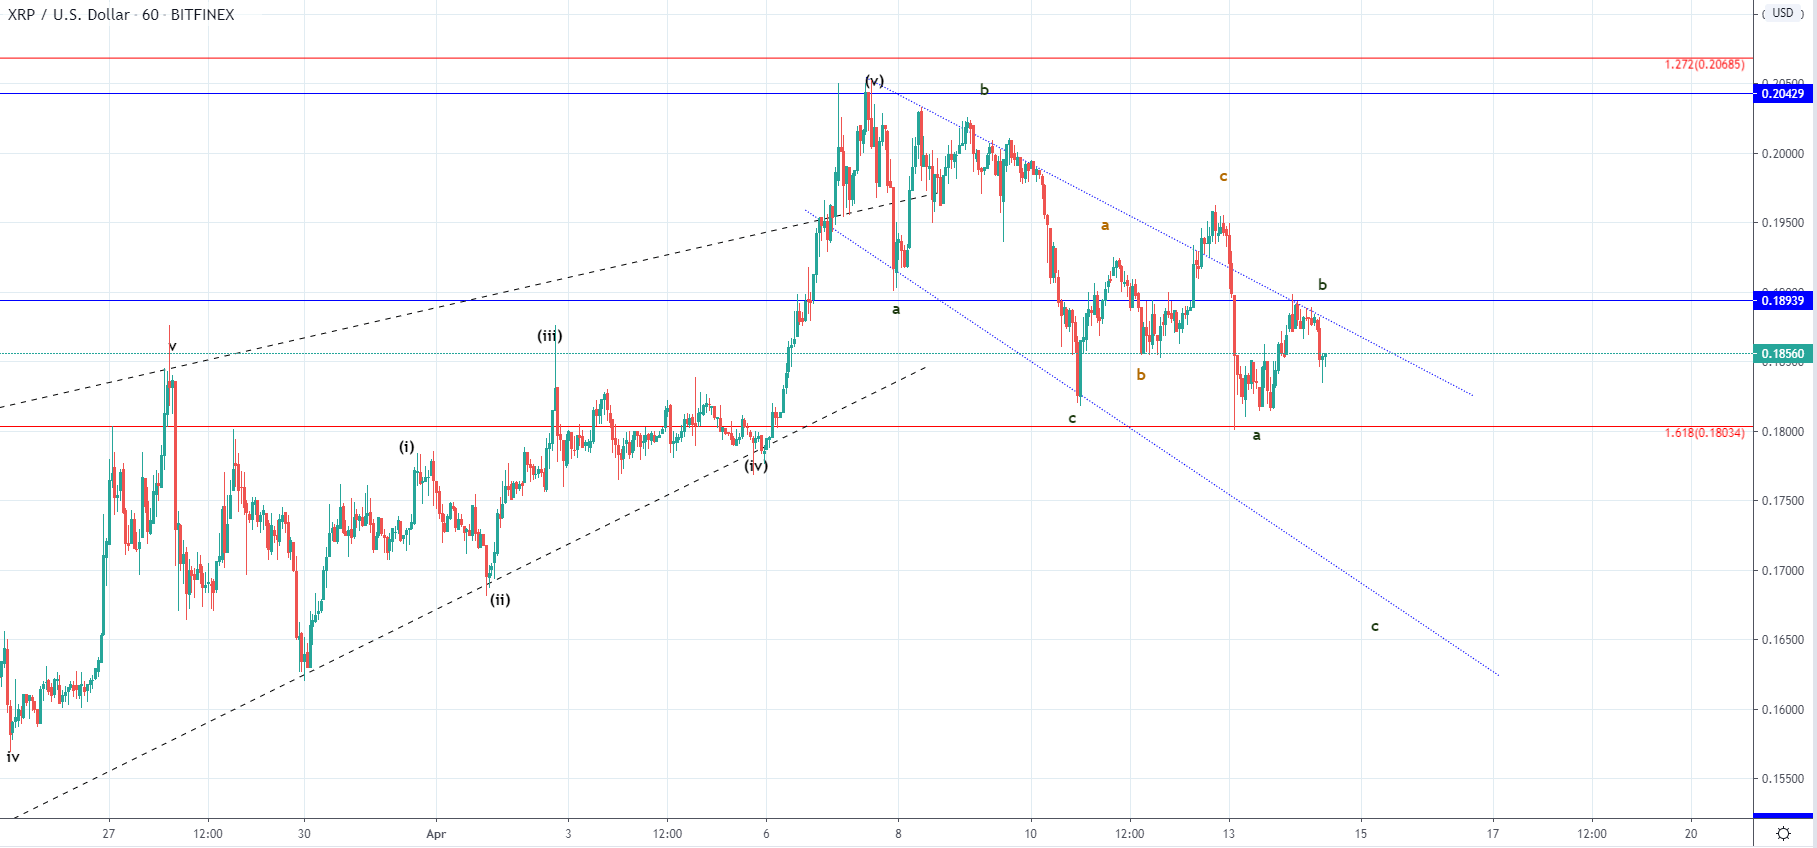 As you can see the price has been in a descending channel from the 8th of April after an interaction with the $0.204 level where it found resistance. This was the completion of the 5th wave from the lower degree similarly like in the case of Bitcoin which is why this descending range has been formed. Two consecutive ABC correction have been made which is why we are most likely seeing the third one.
B wave from the now presumed 3rd ABC correction to the downside has interacted with the descending channels resistance and was rejected which is why we are most likely going to see the price of Ripple heading below the 1.618 Fibonacci level for a lower low.
FXOpen offers the world's most popular cryptocurrency CFDs*, including Bitcoin and Ethereum. Floating spreads, 1:2 leverage — at your service (additional fees may apply). Open your trading account now or learn more about crypto CFD trading with FXOpen.
*Important: At FXOpen UK, Cryptocurrency trading via CFDs is only available to our Professional clients. They are not available for trading by Retail clients. To find out more information about how this may affect you, please get in touch with our team.
This article represents the opinion of the Companies operating under the FXOpen brand only. It is not to be construed as an offer, solicitation, or recommendation with respect to products and services provided by the Companies operating under the FXOpen brand, nor is it to be considered financial advice.
Stay ahead of the market!
Subscribe now to our mailing list and receive the latest market news and insights delivered directly to your inbox.


Latest articles

EUR/USD Eyes Gains As USD/CHF Weakness Deepens Again
EUR/USD started a fresh increase above 1.1700 and 1.1720. USD/CHF declined further and is now struggling below 0.7835.
Important Takeaways for EUR/USD and USD/CHF Analysis Today
· The Euro started a decent increase from

Apple: Earnings Day Above the Activity Zone
On 30 April, after the market close, Apple Inc. will release its financial results for the second quarter of fiscal 2026. The consensus forecast, based on estimates from 31 analysts, points to revenue of around $109.7 billion, with expected

USD/JPY and USD/CHF Near Key Levels: The Dollar Supported by the Fed
The US dollar continues to trend upwards following the Federal Reserve meeting, drawing support from the regulator’s moderately hawkish stance and comments by Jerome Powell. Markets interpret the Fed’s rhetoric as a signal that restrictive policy is likely