BTC/USD in a correction, XRP/USD lagging behind
BTC/USD
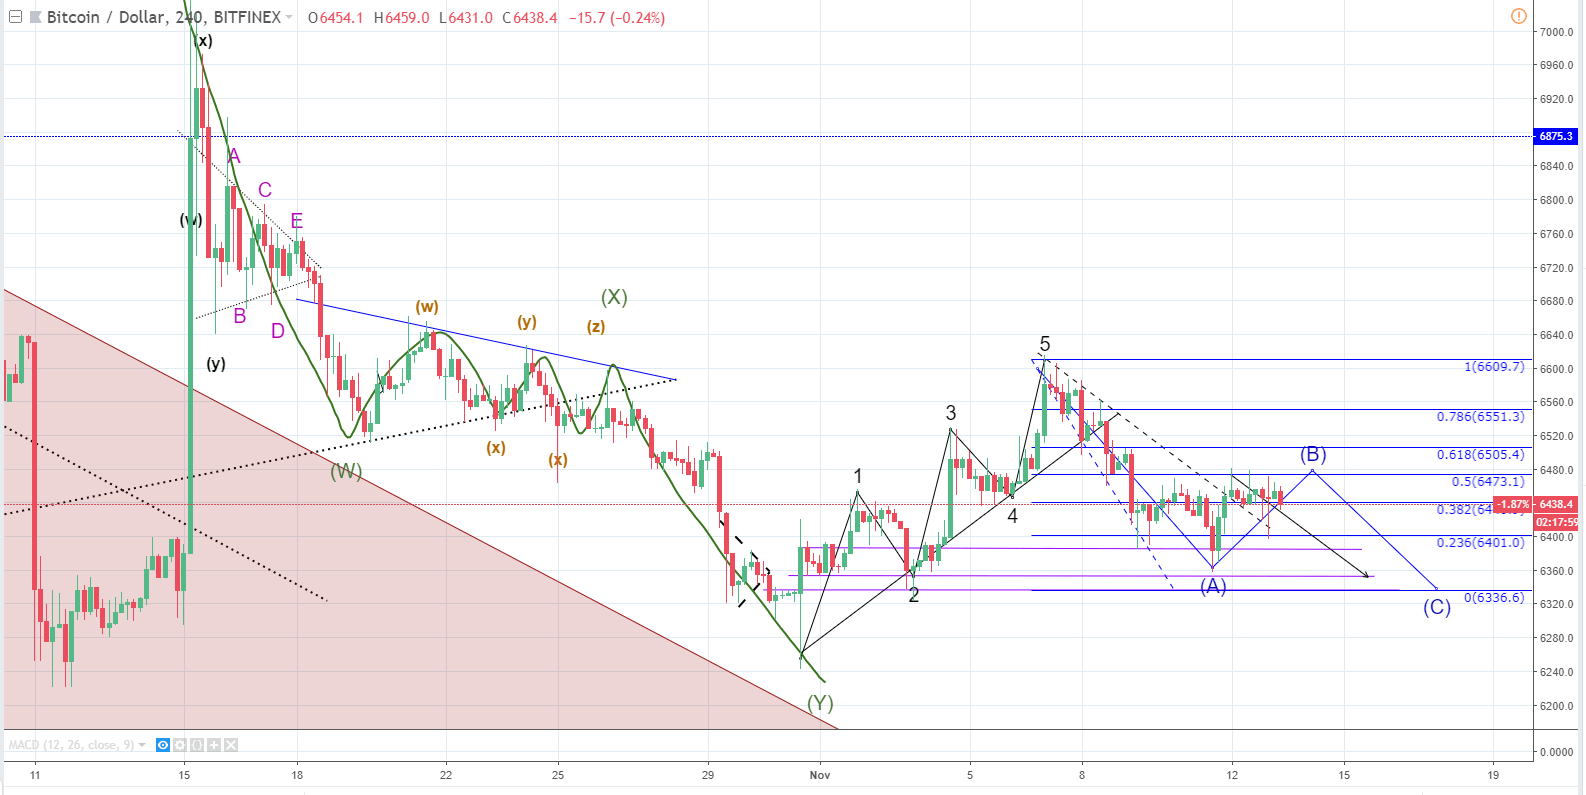
Last Tuesday, November 6th, the price of Bitcoin was at the opening around $6470, and measuring to its current levels of $6438 the price has fallen by only 0.49%. The price hit its recent high the next day on November 7th reaching $6609 and spiking up to $6615 from where the price has been in a downtrend correcting, reaching the recent low at $6380, and spiking down to $6358.7 at its low. Measured from the recent high to the recent low, the price has pulled back by 3,44% but has recovered since its making up for the downfall and is now at 2,61%.
In our last week’s analysis, it was projected that “the 5 wave could get a bit higher to the marked zone ($6560-6580) but in both cases, I would be looking at more downside for Bitcoin in the upcoming period as after an impulsive 12345 a correction occurs according to the Elliott Wave Principle”.
Looking at the current 4-hour chart you can see that this happened: the price went further up but the 5 wave final candle closed at $6580, after which a correction occurred. For now, I labeled it as ABC, and, as I have adjusted the 0.5 Fibonacci retracement level to the current levels, a target at $6336.6 has been projected by the end of this minor correction.
This scenario is a bullish one in which the prior WXY correction ended and we are now seeing a continuation from the breakout momentum off of the descending triangle, and the five waves to the upside followed by a three wave correction would be first two waves of a higher degree count. This scenario will be invalidated if the price goes below the first impulse wave starting point, which is at around $6255.
Looking at the previous structure you can see it labeled as an intermediate three wave WYX correction after the price broke out from the descending triangle on 15th of October. This correction might still be in play and prolonged by two waves. In this case, the five waves to the upside would be the second wave X and this current downside movement is the final wave Z. If it is true, the price will go down further then projected at the end of C wave at $6336.6 and potentially even beyond the prior low at $6250.
XRP/USD
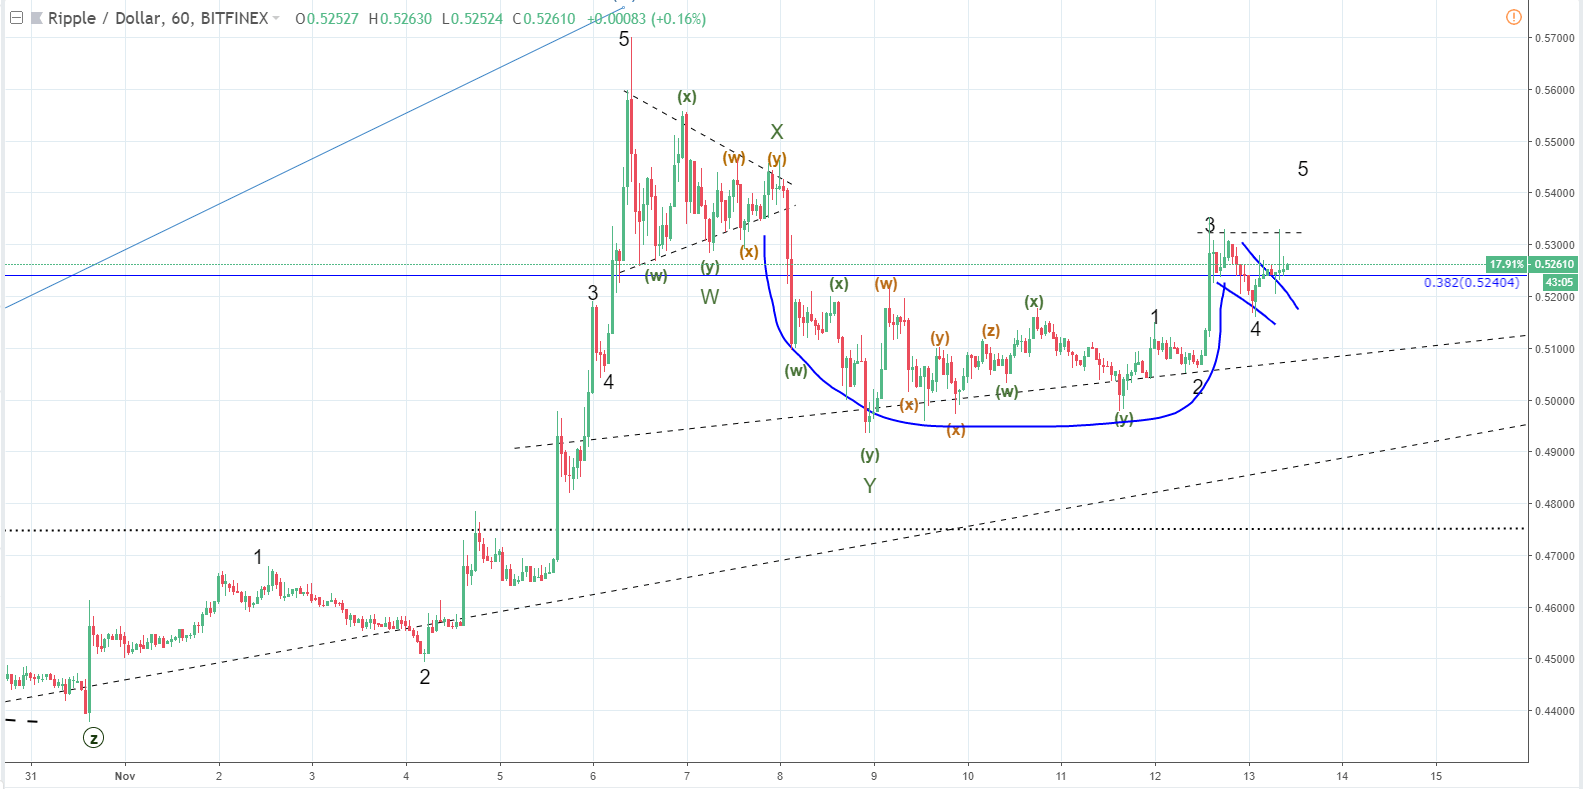
On November 6th the price of Ripple was $0.558 at its high which is also the prior weeks high. Two day’s later the price fell to $0.495 but has recovered since then. The cryptocurrency is now being traded at $0.527, 5,44% off the mentioned high.
On the hourly chart, you can see that the price action has formed a cup and handle pattern after the five wave impulse to the upside ended. I have meticulously counted the sub waves in order to project the likelihood of the future price pathway. As you can see the cup and handle are constituted from three corrections followed by an impulsive move to the upside, where the 4 wave correction is the handle itself. As the price broke out from the handle on the upside, I would be expecting that the price goes further up beyond the wave 3, which ends around $0.532.
Sometimes wave 5 can end on the same levels as the wave 3, and that is why today’s spike to the $0.532 level could be interpreted as the end, but by looking at the momentum behind the 3 wave, I believe it is unlikely and we are going to see another pump to the upside potentially with more power as in many cases with the price of Ripple where 5 wave is the extended one.
After this impulse wave is done, I would be expecting to see correction much like we have seen in the case of Bitcoin.