BTC/USD increased by 2%, XRP/USD raised by 5% for a week
BTC/USD
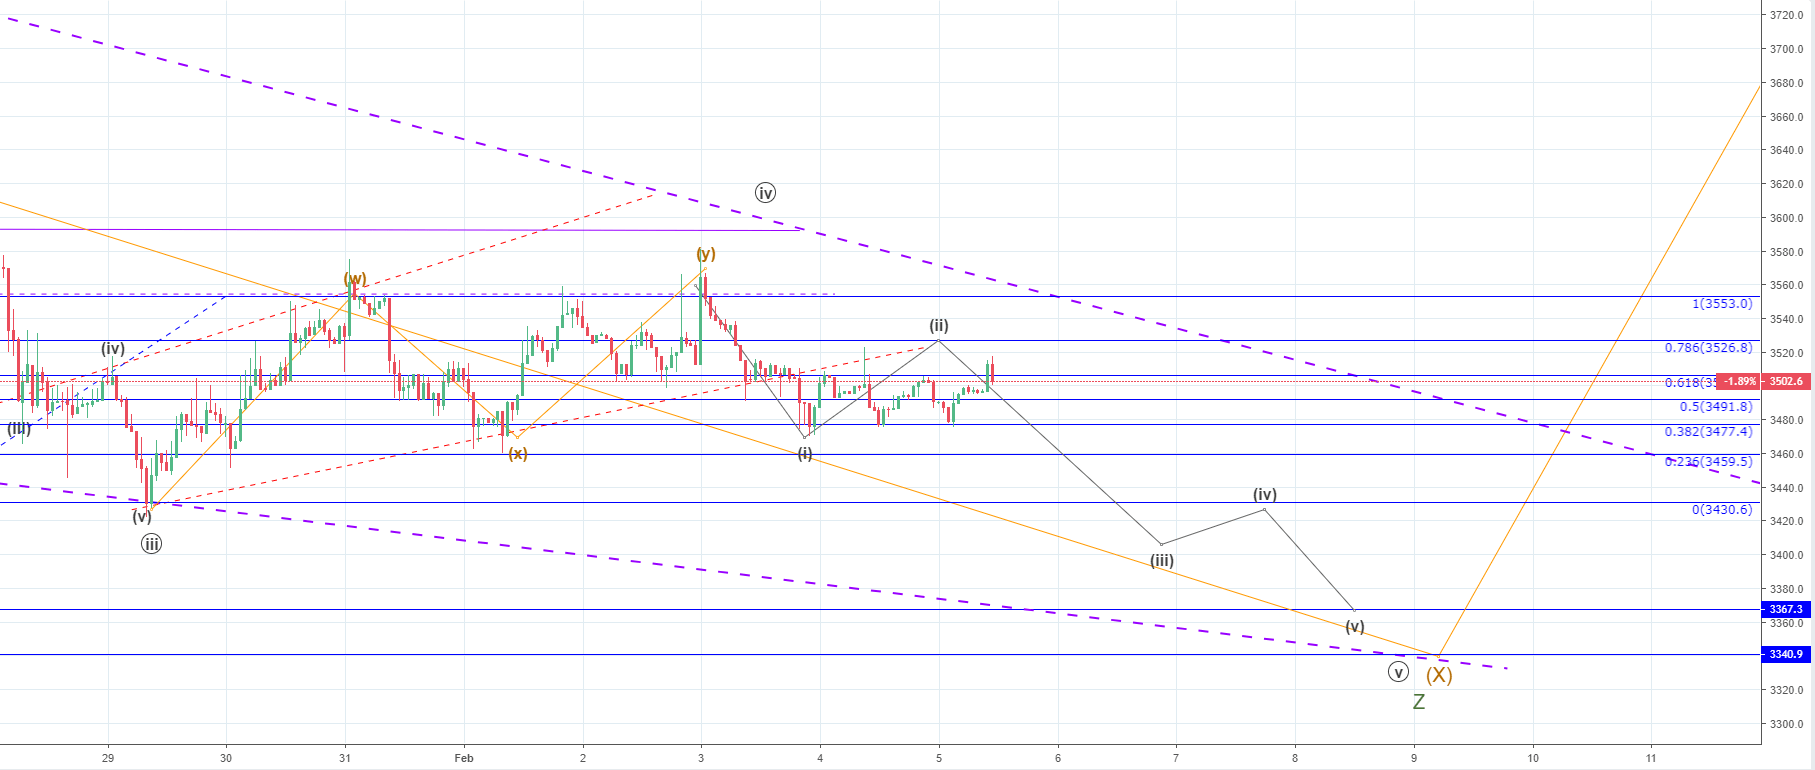
At the moment of the last week’s analysis on Tuesday 29th of January, the price of Bitcoin was $3430 at its lowest point. That was the end of the 3rd wave to the downside from the Minute impulsive move, which is the corrective wave Z of a higher degree Minor count. After this downfall from $3707 ended the 4th wave has begun and the price action created an ascending channel in which a Minuette WXY occurred.
The price increased to $3553 at first going higher than the previous lower high on the 4th Minute wave of the 3rd Minute one at $3506 at the 0.618 Fibonacci retracement level and then fell down to $3477, which was a higher low compared to the ending point of the 3rd Minute wave ending point. This was an early indication of the minor uptrend and was continued for another cycle going just slightly above the prior high, but then fell exactly on the same level as the prior low, which is an indication of the momentum slowing down and shifting direction.
Yesterday we have seen a breakout from the ascending channel, which could very likely mean that the 4th wave has ended on the Minuette Y wave and that the last impulsive move to the downside has started. Now the price is in an upward trajectory, which is most likely the 2nd Minuette wave of the 5th Minute one and is serving as a retest of the prior support for the resistance. That is why the price has interacted with the ascending channels support and was rejected, but it pushing the price back to the 0.382 Fibonacci level. It is its key support since the price has fallen 4 times on it in a search for support after encountering the sellers pressure.
As the price is now heading upwards it is again going to encounter resistance and this time it would likely be a lower high, so I have projected that the price would go to around 0.786 Fibonacci level. The price could go further up to the vicinity of the prior high but that would only mean that the 4th wave hasn’t ended and that the current movement is the prolongation of the WXY Minuette correction by two more waves X and Z. In that case, the area of the intersection between the falling wedge resistance (upper interrupted purple line) and the horizontal resistance level at $3553 or the 1 Fibo level would be an optimal target.
In any way when this minor increase ends I would expect more downside for the price of Bitcoin as the Z wave should end developing to the downside. The price target for the expected decrease would be between around the falling wedge support line intersection with the horizontal support zone from $3367-3340.
XRP/USD
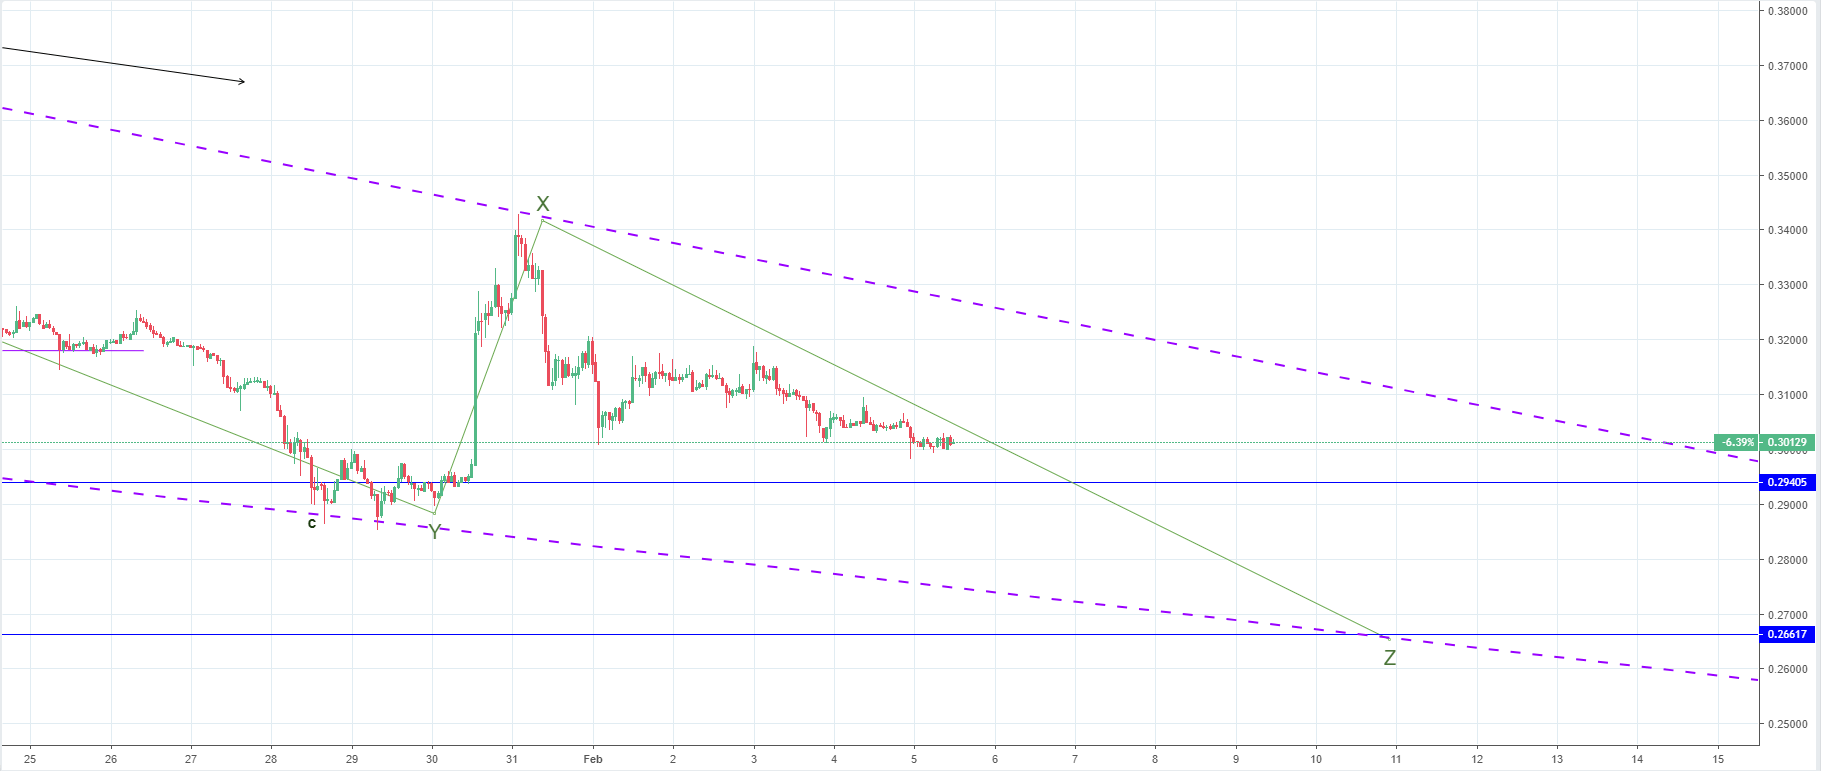
From last Tuesday when the price of Ripple was $0.2874 at its lowest point, measured to current level of $0.3013, the price has increased by 4.75%. The price went up further immediately after the interaction with the falling wedge support line on last Tuesdays low, up to $0.3431. It was an interaction with the falling wedge resistance line, which ended as a rejection propelling the price downward again.
The interaction with the falling wedge resistance was the end of the Minor X wave, so more downside is now expected as the Z wave has started. The price is currently in some kind of a descending triangle, which I haven’t labeled on the chart but is evident by the Elliott Wave Z wave, and is currently on the horizontal support from that triangle looking to break out to the downside.
If the breakout occurs and I believe that it will, we are likely going to see enough momentum for breakage of the horizontal support level at $0.29405 and further sideways movement to the next one at $0.26617 where the falling wedge support intersects it.
Try cryptocurrency trading with FXOpen broker.