BTC/USD still under pressure while XRP/USD increased by over 18%
BTC/USD
Since last Tuesday the price of Bitcoin has increased by 2.41%, coming from $6327 to the current level at $6484.5.
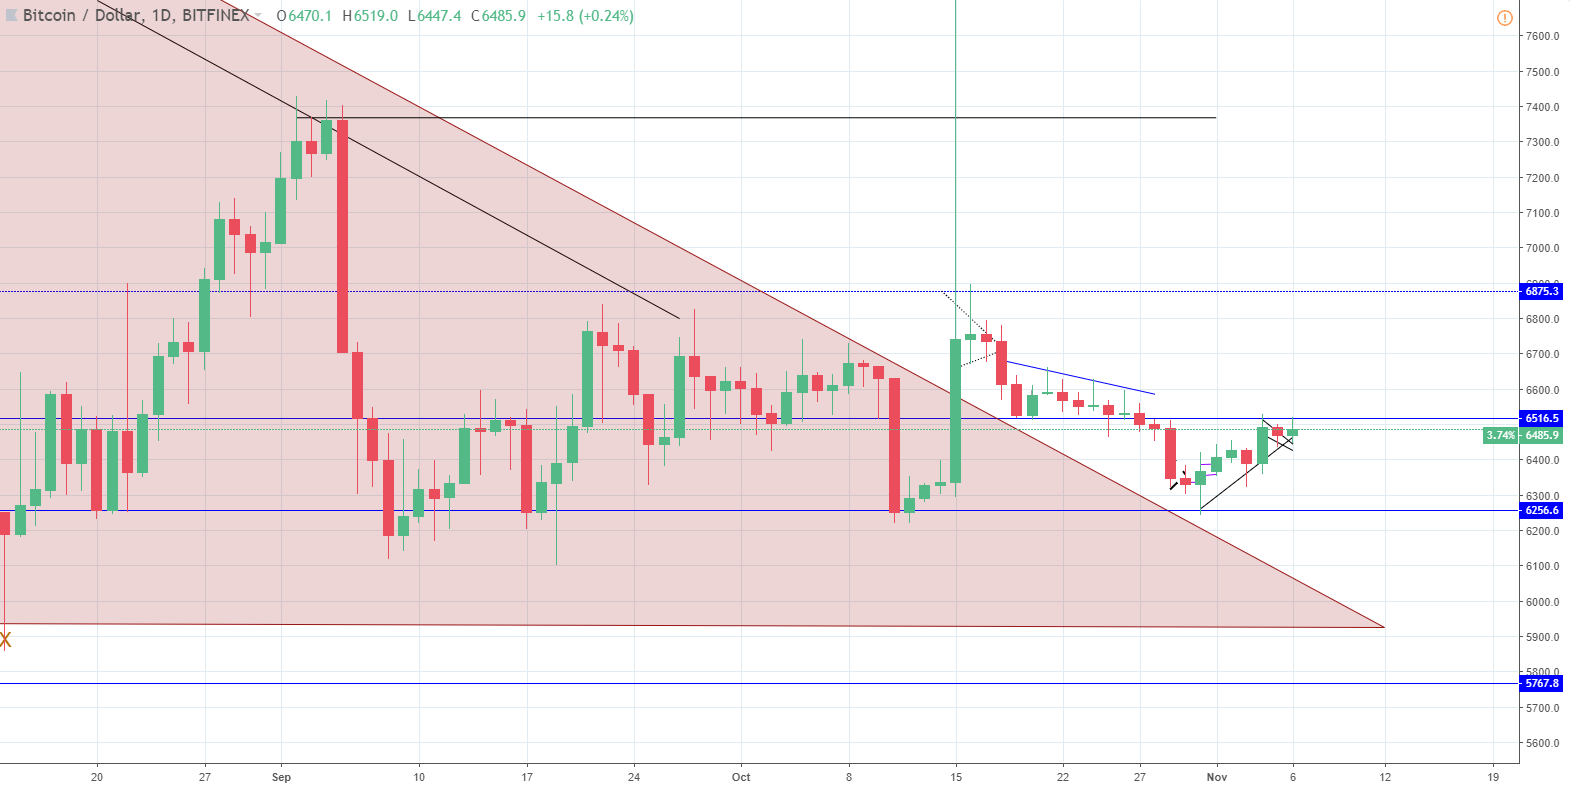
Looking at the daily chart we can see that the price of Bitcoin interacted with the horizontal support level at $ 6256 last Wednesday. That is why we have seen this increase over the course of the last week to the next horizontal level at $6516, which now serves as resistance. Yesterday’s candle was a red one indicating that the price might get rejected by the horizontal level, but as today’s candle is a green one with a wick interacting with the level, we are yet to see if the rejection gets validated or was it just a correction before a breakout.
After the increase to above $7600 ended as a spike, I was expecting the price to interact with the descending triangle's resistance line to retest it for support before a breakout could be considered. But as the price retraced by 100% and is now in an upward trajectory, I believe that the interaction will never happen unless the price falls straight down from here. As the price pulled back by 100% from the spike on Monday, October 15, it is still unclear whether this could be viewed as a “fakeout” or not because the price hasn’t quickly dropped inside the territory of the descending triangle. But it definitely shouldn’t be viewed as a breakout considering that the price retraced back to the same levels from which the increase was made.
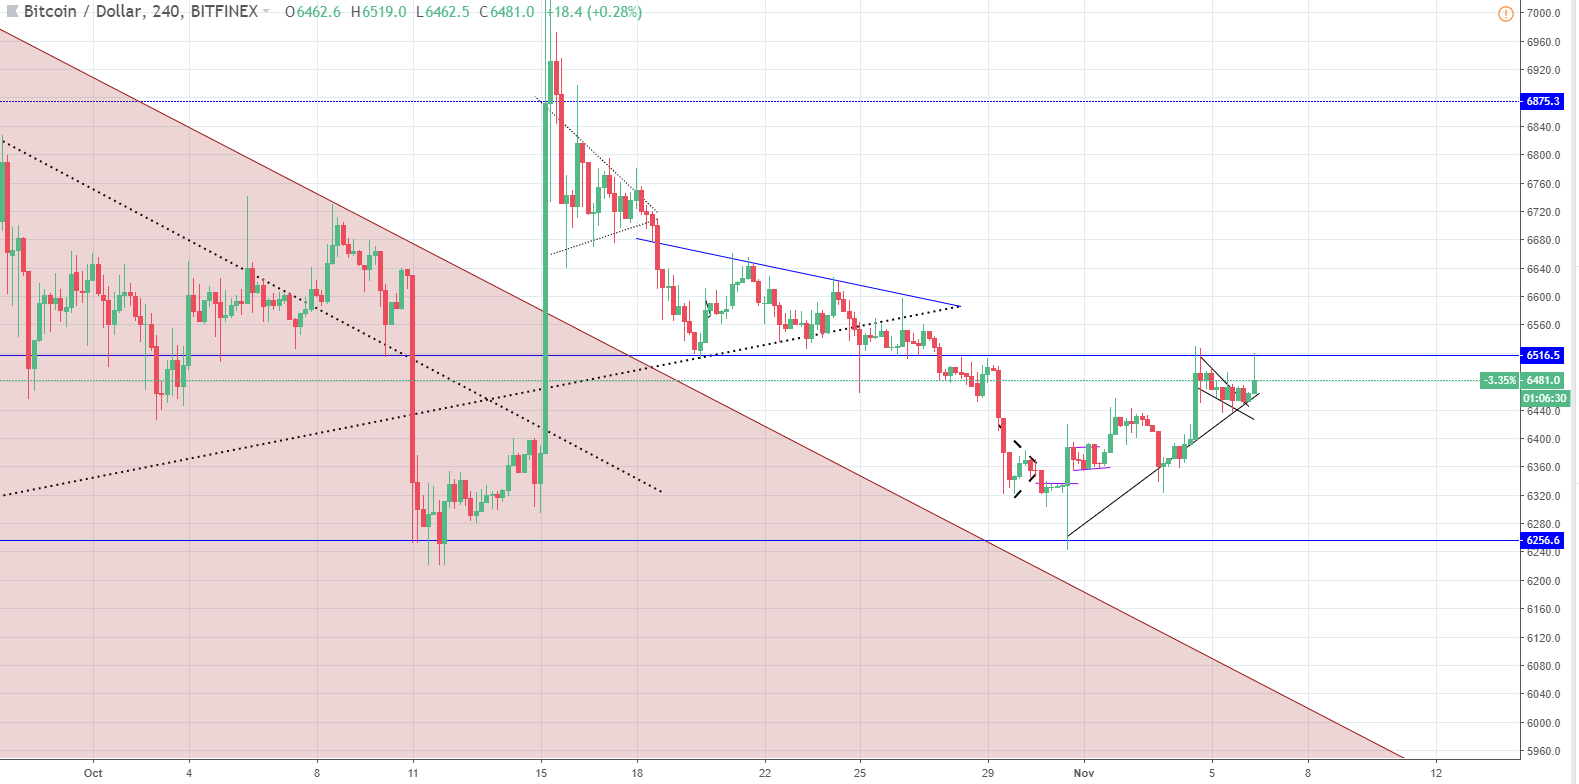
Looking at the 4-hour chart you can see that the price has found support on the minor uptrend support line but is at the same time struggling to go past the $6516.5 horizontal support level.
The long wick from above indicates selling pressure. That is why we might see another decrease in price for the short-term.
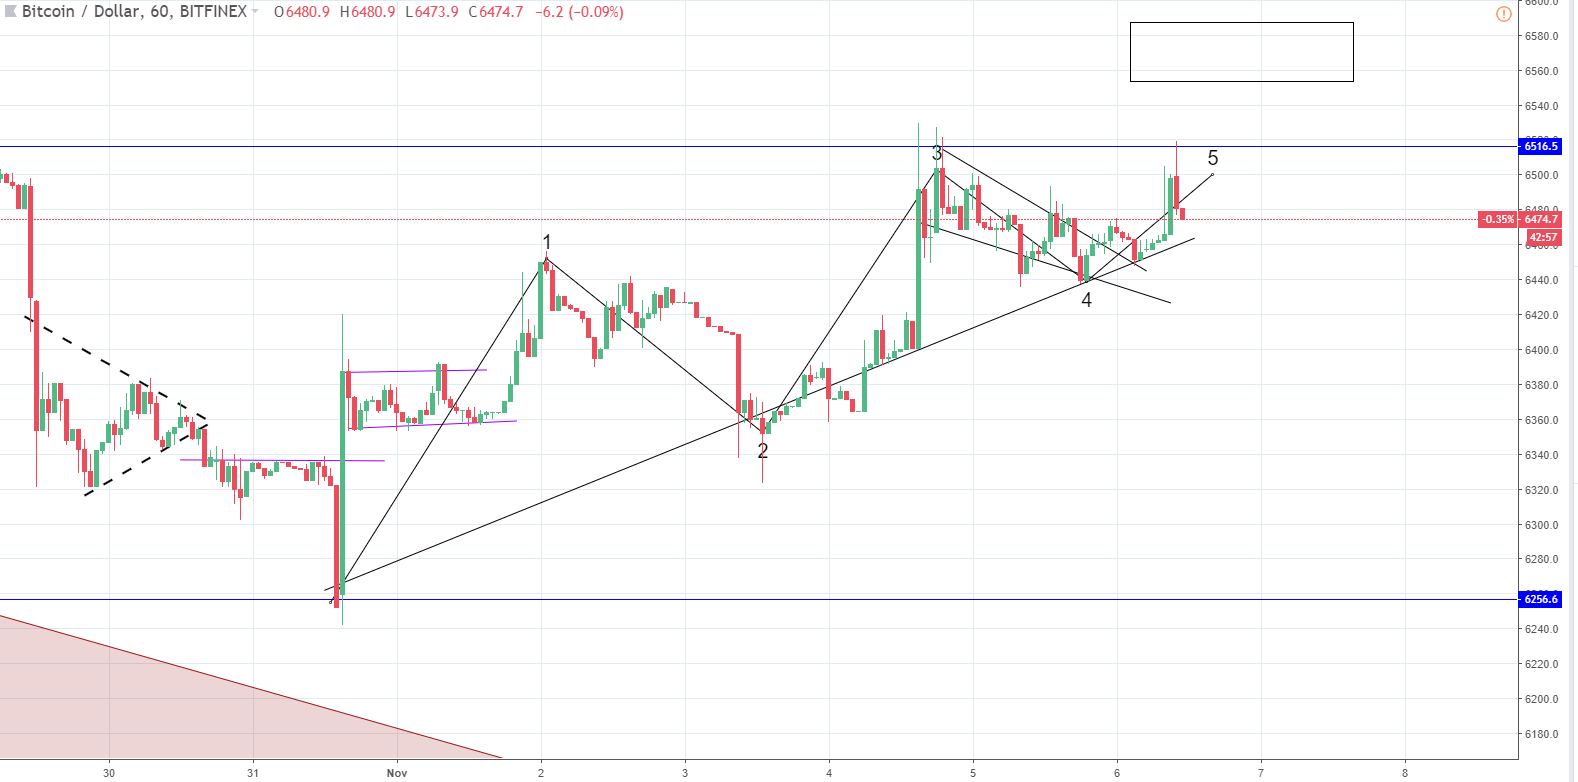
Zooming into the hourly chart you can see that the Elliott Wave count implies that the up move is done or almost done.
The 5 wave could get a bit higher to the market zone but in both cases, I would be looking at more downside for Bitcoin in the upcoming period as after an impulsive 12345 a correction occurs according to the Elliott Wave Principle.
XRP/USD
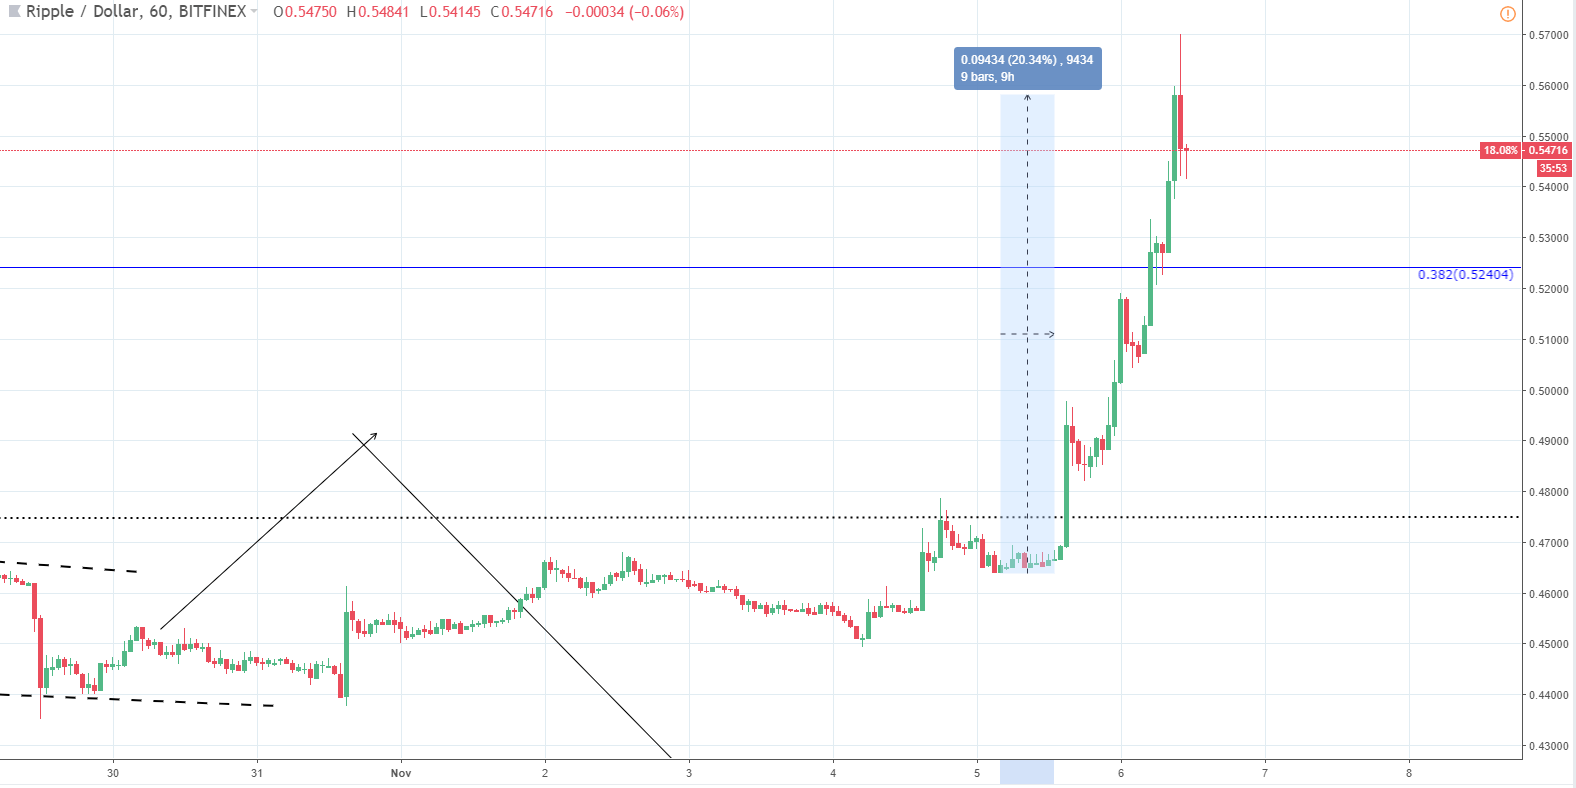
From yesterday’s low at $0.464 the price of Ripple has increased by over 18% measured to the current levels but has gone on further up, spiking to $0.57. But the hourly candle has closed at $0.558, marking a 20.34% increase.
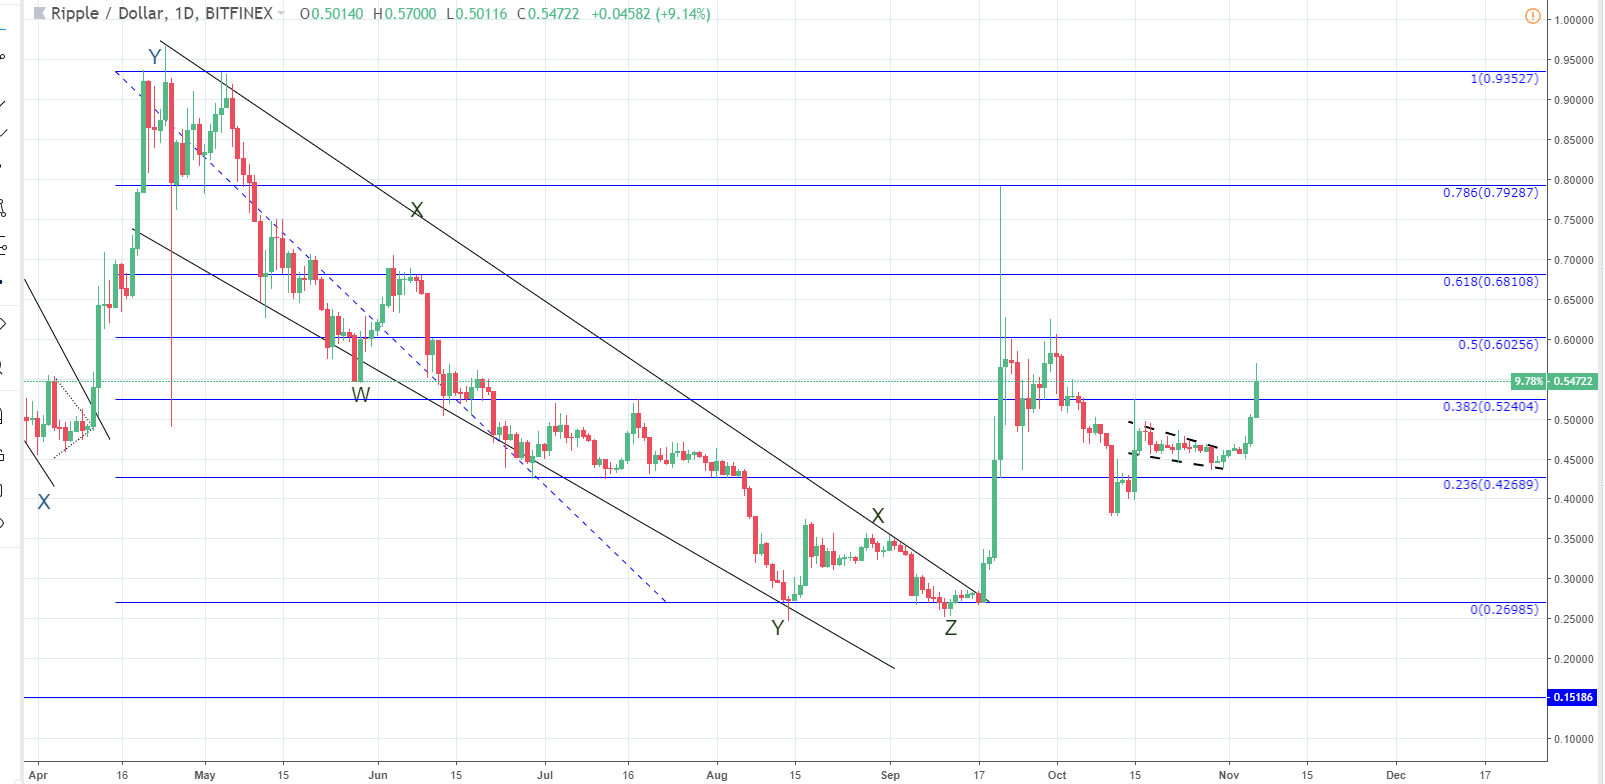
If we zoom out to the daily chart we can see that the price of Ripple has been experiencing a recovery after a correction pushed the price to its lowest lows at $0.26
The recovery by 107% has so far been measured from the mentioned low, but we might see another increase that exceeds the prior high at $0.5818 as the price is currently in an upward trajectory.
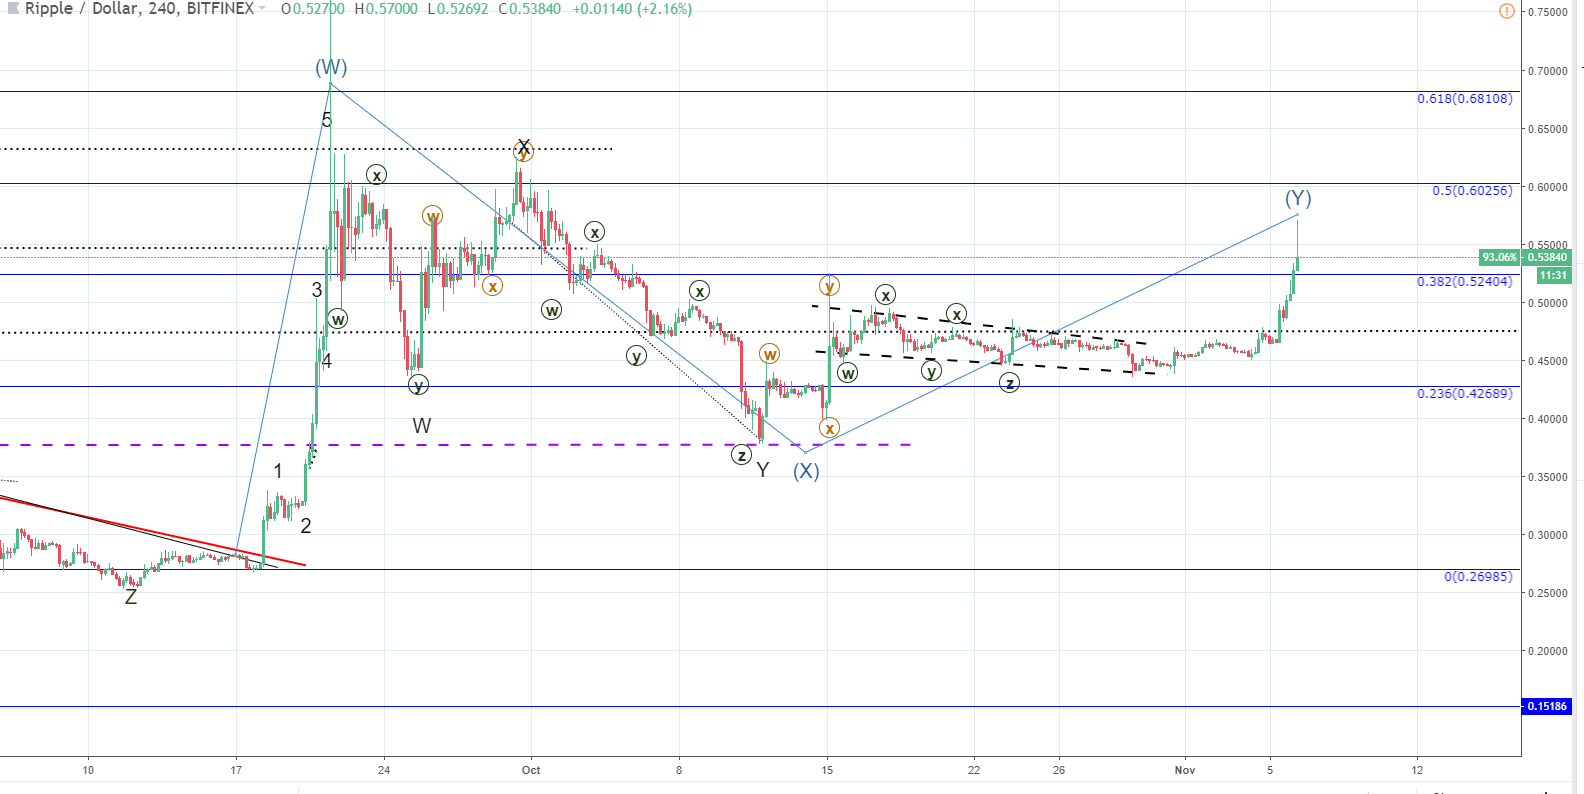
Zooming into the 4-hour chart you can see my Elliott Wave projection in which the recovery is done, or almost done.
The final wave Y can go up to the 0.5 Fibonacci level again. But as indicated by the wick from above it is highly unlikely, and that is why in the upcoming period I would expect that the price of Ripple cools off and undergoes a correciton.