


BTCUSD and XRPUSD Technical Analysis – 08th NOV 2022
FXOpen

BTCUSD: Shooting Star Pattern Below $21470
Bitcoin was unable to sustain its bullish momentum and after touching a high of 21470 on 05th Nov, the price started to correct lower against the US dollar and is now trading below the $20000 handle in the European trading session.
We can see that the price is declining due to heavy selling pressure seen across the global crypto markets, and the price of bitcoin is expected to break below the $19000 handle this week.
We have seen a bearish opening of the markets this week.
We can see the formation of bearish engulfing lines in the 1-hour time frame.
The price of bitcoin is below the pivot point and camarilla S3 support level, indicating the bearish trends present in the market.
We can clearly see a shooting star pattern below the $21470 handle which is a bearish reversal pattern because it signifies the end of an uptrend and a shift towards a downtrend.
Bitcoin touched an intraday high of 20666 and an intraday low of 19413 in the Asian trading session today.
Both the STOCH and Williams percent range are indicating overbought levels which means that in the immediate short term, a decline in the prices is expected.
The relative strength index is at 27 indicating a VERY WEAK demand for bitcoin, and the continuation of selling pressure in the markets.
Bitcoin is now moving below its 100 hourly exponential moving average and above its 200 hourly exponential moving average.
Most of the major technical indicators are giving a STRONG SELL signal, which means that in the immediate short term, we are expecting targets of 19000 and 18500.
The average true range is indicating HIGH market volatility with a strong bearish momentum.
- Bitcoin: bearish reversal seen below $21470
- The STOCHRSI range is indicating an oversold level
- The price is now trading below its pivot level of $19818
- Most of the moving averages are giving a STRONG SELL market signal
Bitcoin: Bearish Reversal Seen Below $21470

We can now see that the price of bitcoin failed to clear the $22000 handle and is now moving towards the $19000 level.
The MACD has crossed down its moving average in the daily time frame indicating a bearish trend.
The parabolic SAR indicator is giving a bearish reversal signal in the daily time frame.
We can see the formation of a bearish price crossover pattern with adaptive moving average AMA20 and AMA50 in the daily time frame.
We have also seen a black evening star in the weekly time frame.
The immediate short-term outlook for bitcoin is strongly bearish, the medium-term outlook has turned bearish, and the long-term outlook remains neutral under present market conditions.
Bitcoin’s support zone is located at $19475 which is a 38.2% retracement from a 4 week low, and the price needs to remain above these levels for any potential bullish reversal in the markets.
The price of BTCUSD is now facing its classic support level of 19646 and Fibonacci resistance level of 19700 after which the path towards 19000 will get cleared.
In the last 24hrs, BTCUSD has decreased by 4.68% by 970$ and has a 24hr trading volume of USD 66.898 billion. We can see an increase of 51.65% in the trading volume compared to yesterday, which is due to the heavy selling pressure seen in the global markets.
The Week Ahead
The price of Bitcoin is moving in a strongly bearish zone below the $20000 level. Further downsides are projected at $19000 and $18500 as the immediate targets.
Now we are aiming for $19385which is an 18-day moving average.
The daily RSI is printing at 45 which indicates a neutral demand for bitcoin and a shift towards the consolidation phase in the markets.
The price of BTCUSD has already crossed below $19855 which is a 50% retracement from a 4-week high/low.
The weekly outlook is projected at $19000 with a consolidation zone of $19250.
Technical Indicators:
The moving averages convergence divergence MACD (12, 26): is at -303.10 indicating a SELL
The commodity channel index CCI (14): is at -107.49 indicating a SELL
The rate of price change ROC: is at -4.53 indicating a SELL
The bull/bear power (13): is at -775.38 indicating a SELL
XRPUSD: Bearish Engulfing Pattern Below 0.5097
Ripple was unable to sustain its bullish momentum, and after touching a high of 0.5097 on 05th Nov, the price started to decline against the US dollar touching a low of 0.4245 on 08th Nov.
We can see that the price of Ripple has already dropped below the 0.4400 handle and is poised to break below the 0.4200 levels.
We can see the formation of a bearish harami pattern in the 1-hour time frame.
The support of the channel and the support of the triangle is broken in the daily time frame.
We can clearly see a bearish engulfing pattern below the 0.5097 handle which is a bearish reversal pattern because it signifies the end of an uptrend and a shift towards a downtrend.
Ripple touched an intraday high of 0.4622 and an intraday low of 0.4238 in the Asian trading session today.
We can see that the price of Ripple continues to remain under pressure due to heavy selling. The global investor sentiment is weak in the short time frame.
The relative strength index is at 31 which signifies a VERY WEAK demand for Ripple at the current market price, and the continuation of selling pressure in the markets.
All of the moving averages are giving a SELL signal at the current market level of 0.4392.
Ripple is now trading below its pivot level of 0.4393 and facing its classic support level of 0.4346 and Fibonacci support levels of 0.4362 after which the path towards 0.4200 will get cleared.
All of the major technical indicators are giving a STRONG SELL signal.
- Ripple: bearish reversal seen below the 0.5097 level
- STOCHRSI is indicating a neutral level
- The average true range indicates HIGH volatility
- Ripple gains bearish bias against the US dollar
Ripple: Bearish Reversal Seen Below 0.5097
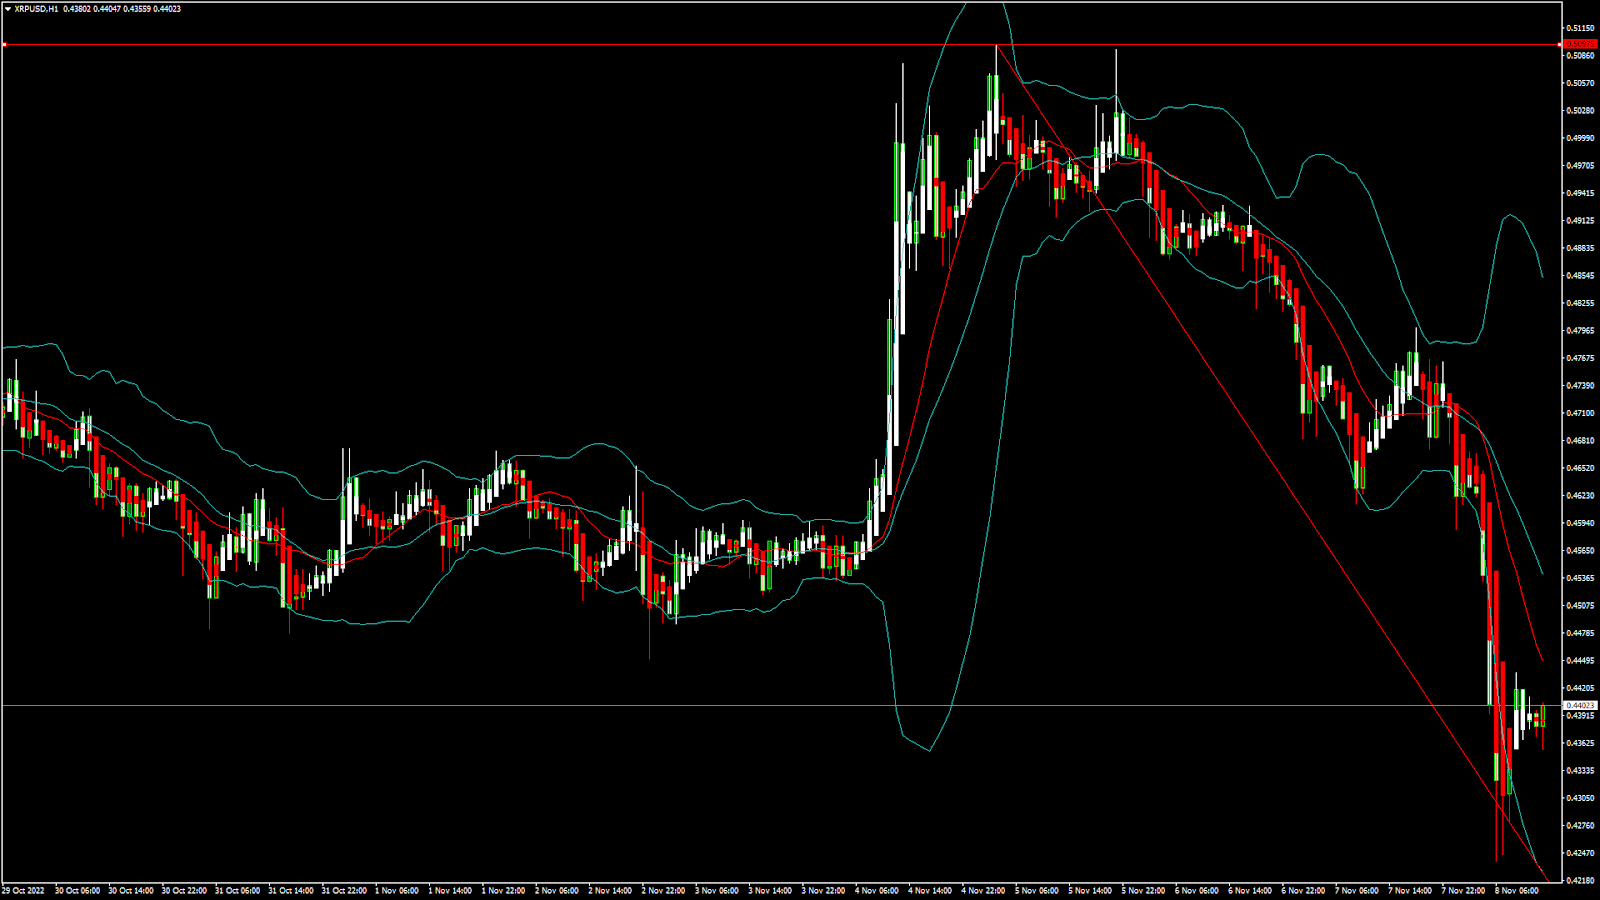
We can see that the price of Ripple continues to remain in a bearish phase below the 0.4400 level, and now we are aiming to cross the 0.4200 handle this week.
The MACD has crossed down its moving average in the daily time frame.
We can see the formation of a bearish harami pattern in the 1-hour time frame.
We can see a bearish price crossover pattern with adaptive moving average AMA20 and AMA50.
The short-term outlook for Ripple has turned strongly bearish, the medium-term outlook is bearish, and the long-term outlook is neutral under present market conditions.
The parabolic SAR indicator is giving a bearish reversal signal in the daily time frame.
The price of XRPUSD has decreased by 6.54% with a price change of $0.03081 in the past 24hrs and has a trading volume of 2.215 billion USD.
We can see an increase of 64.84% in the trading volumes of Ripple compared to yesterday, which is due to heavy selling pressure.
This Week Ahead
The price of Ripple continues to correct lower against the US dollar and bitcoin. XRP/USD continues its decline below the 0.4500 handle and is now aiming towards 0.4200 and 0.4000 as the immediate targets.
The immediate support level is located at 0.4078 which is a 38.2% retracement from 13-week high/low.
We can see a continuous progression of a bearish trend line formation from 0.5097 towards the 0.4150 level.
The weekly outlook for Ripple is projected at 0.4200 with a consolidation zone of 0.4000.
Technical Indicators:
The STOCH (9, 6): is at 30.52 indicating a SELL
The moving averages convergence divergence MACD (12, 26): is at -0.010 indicating a SELL
The bull/bear power (13): is at -0.0146 indicating a SELL
The rate of price change ROC: is at -7.29 indicating a SELL
FXOpen offers the world's most popular cryptocurrency CFDs*, including Bitcoin and Ethereum. Floating spreads, 1:2 leverage — at your service (additional fees may apply). Open your trading account now or learn more about crypto CFD trading with FXOpen.
*Important: At FXOpen UK, Cryptocurrency trading via CFDs is only available to our Professional clients. They are not available for trading by Retail clients. To find out more information about how this may affect you, please get in touch with our team.
This article represents the opinion of the Companies operating under the FXOpen brand only. It is not to be construed as an offer, solicitation, or recommendation with respect to products and services provided by the Companies operating under the FXOpen brand, nor is it to be considered financial advice.
Stay ahead of the market!
Subscribe now to our mailing list and receive the latest market news and insights delivered directly to your inbox.


Latest articles

AI Valuations Are Back in the Spotlight
Artificial intelligence remains the dominant investment theme of 2026, but investors are increasingly questioning whether AI stock valuations are keeping pace with reality.
💰 Big Tech continues to invest at an unprecedented scale, with hyperscaler AI spending projected to exceed $800

AUD/CAD: Months of Indecision — Is a Breakout Finally Coming?
The Australian dollar has clawed back most of its end-of-June losses, when it touched three-month lows against the greenback amid escalating Middle East tensions. Since then, sentiment has improved: the RBA's Assistant Governor Sarah Hunter signalled the board stands ready

USD/JPY: Battling at the Top of the Triangle
On 3 July, Japan's Finance Minister, Satsuki Katayama, stated that the Ministry of Finance remains in close contact with US authorities regarding developments in USD/JPY as the yen traded near its weakest level in almost 40 years. Similar verbal