


BTCUSD and XRPUSD Technical Analysis – 09th AUG 2022
FXOpen

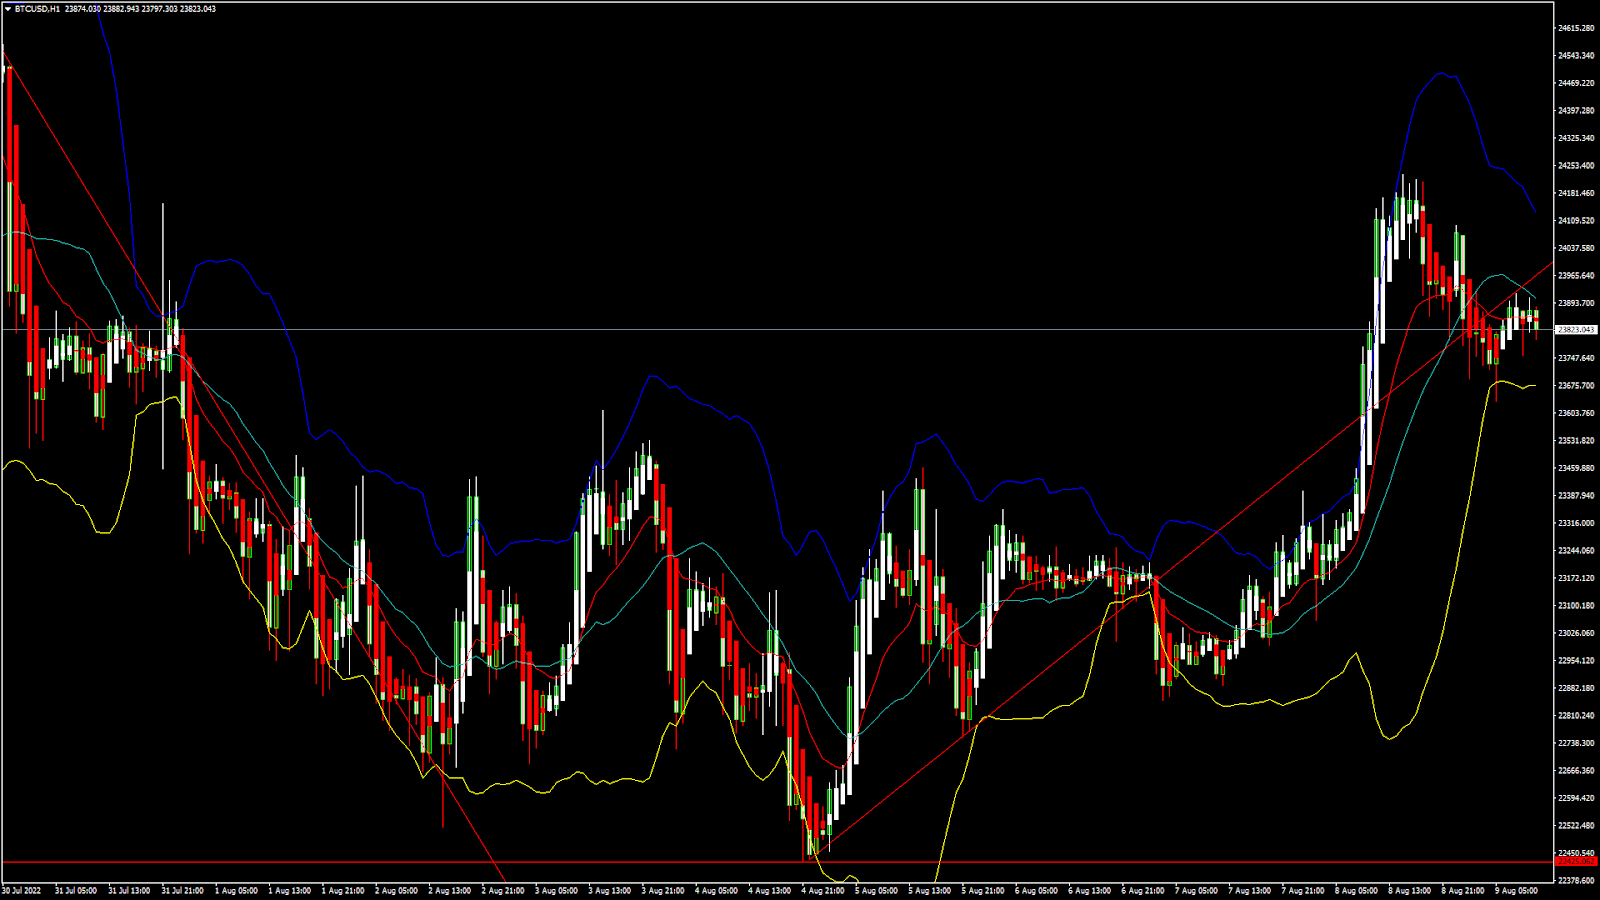
BTCUSD: Bullish Engulfing Pattern Above $22425
Bitcoin was unable to sustain its bearish momentum and after touching a low of 22431 on 04th Aug started to correct upwards against the US dollar crossing the $24000 handle on 08th Aug.
We can see that bitcoin failed to clear its resistance zone located at $25000 for the second time this month.
After touching a high of $24230 we can see some downwards correction in the prices towards the $23800 level.
We can clearly see a bullish engulfing pattern above the $22425 handle which is a bullish reversal pattern because it signifies the end of a downtrend and a shift towards an uptrend.
Bitcoin touched an intraday high of 23922 in the Asian trading session and an intraday low of 23639 in the Asian trading session today.
Both the STOCH and Williams percent range are indicating overbought levels which means that in the immediate short term, a decline in the prices is expected.
The relative strength index is at 50 indicating a NEUTRAL demand for bitcoin at the current market levels and the continuation of the consolidation phase in the markets.
Bitcoin is now moving above its 100 hourly simple moving average and its 200 hourly simple moving averages.
Some of the major technical indicators are giving a buy signal, which means that in the immediate short term, we are expecting targets of 24000 and 24500.
The average true range is indicating less market volatility with a mildly bullish momentum.
- Bitcoin: bullish reversal seen above $22425
- The STOCHRSI is indicating an oversold level
- The price is now trading just below its pivot levels of $23858
- Some of the moving averages are giving a buy market signal
Bitcoin: Bullish Reversal Seen Above $22425
The price of bitcoin is struggling to move above the $24000 handle after it entered into a consolidation zone below the $24000 level.
The overall scenario of the markets is neutral at present; we will have to wait till some clear signals emerge for the medium-term range.
We can see that Ichimoku price is under the cloud in the 15-minute time frame indicating the underlying bearish nature of the markets.
The immediate short-term outlook for bitcoin is neutral; the medium-term outlook has turned neutral; and the long-term outlook remains neutral under present market conditions.
Bitcoin’s support zone is located at $22000 and the prices continue to remain above these levels for the continuation of the bullish reversal in the markets.
The price of BTCUSD is now facing its classic resistance level of 23899 and Fibonacci resistance level of 23932 after which the path towards 24000 will get cleared.
In the last 24hrs, BTCUSD has declined by 0.32% by 76$ and has a 24hr trading volume of USD 28.827 billion. We can see an increase of 50.20% in the trading volume as compared to yesterday, which is due to the buying seen by the short-term investors.
The Week Ahead
The price of bitcoin is moving in a consolidation zone under the $24000 level. The price is expected to remain moving into a narrow range between the $23000 and $24000 before any potential breakouts.
The daily RSI is printing at 59 which indicates a bullish market and the move towards the $25000 level.
The trendline formation is seen from the $22400 levels towards the $24000, and we are now looking for the continuation of this trend in the hourly time frame.
The price of BTCUSD will need to remain above the important support level of $22000 this week.
The weekly outlook is projected at $24000 with a consolidation zone of $23000.
Technical Indicators:
The average directional change (14 days): at 15.10 indicating a neutral
The ultimate oscillator: at 68.29 indicating a BUY
The relative strength index (14): at 52.53 indicating a neutral
The commodity channel index (14 days): at -19.17 indicating a neutral
XRPUSD: Bullish Harami Pattern Above 0.3630
Ripple was unable to sustain its bullish momentum and after touching a high of 0.3931 on 02nd Aug started to decline against the US dollar.
We can see a range-bound decline in the price of Ripple due to increased selling by short-term investors.
Now we are testing the important support zone located at 0.3700 which if broken will lead to Ripple touching the level of 0.3500.
We can clearly see a bullish harami pattern above the 0.3630 handle which is a bullish reversal pattern because it signifies the end of a downtrend and a shift towards an uptrend.
Ripple touched an intraday high of 0.3816 in the Asian trading session and an intraday low of 0.3751 in the European trading session today.
Both the average directional change and highs/lows are indicating a neutral level which means that in the immediate short term, a range-bound movement in the price is expected.
The relative strength index is at 45 which signifies a neutral demand for Ripple at the current market prices, and the continuation of the consolidation phase in the markets.
Some of the moving averages are giving a buy signal at the current market levels of 0.3759.
Ripple is now trading just above its pivot levels of 0.3765 and is now facing its classic resistance level of 0.3772 and Fibonacci resistance level of 0.3785 after which the path towards 0.3800 will get cleared.
Some of the major technical indicators are giving a buy signal.
- Ripple: bullish reversal seen above the 0.3630 level
- The average directional change is indicating a neutral level
- The STOCHRSI indicates an oversold market
- Ripple gains bullish bias against the US dollar
Ripple: Bullish Reversal Seen Above 0.3630

We can see that the prices of Ripple continue to move in a narrow range between the 0.3800 and 0.3700 levels in the European trading session today.
The Aroon Indicator is giving a bearish trend in the 2-hour time-frame.
The short-term outlook for Ripple has turned neutral; the medium-term outlook is neutral; and the long-term outlook is neutral under present market conditions.
We can see that Ripple was unable to clear its resistance zone located at 0.400, and now the price is struggling to retain the bullish bias against the US dollar.
We have also detected the formation of MA20 exponential crossover pattern located at 0.3785 which indicates that we may see a short-term downwards correction in the prices.
The price of XRPUSD has decreased by 1.87% with a price change of $0.007153 in the past 24hrs and has a trading volume of 4.060 billion USD.
We can see an increase of 417.85% in the trading volumes of Ripple as compared to yesterday, which is due to the buying seen at lower levels by the medium-term investors.
The Week Ahead
Ripple has entered into a consolidation zone above the 0.3600 handle, and the price is expected to remain in the range-bound movement this week oscillating between the 0.3600 and 0.3800 levels.
The price of XRPUSD is expected to decline further touching the 0.3600 handle after which a recovery is expected in the markets.
We can see the formation of an adaptive moving average of 20 and 50 crossover patterns in the 15-minute time frame indicating the underlying bearish nature of the markets.
The weekly outlook for Ripple is projected at 0.3700 with a consolidation zone of 0.3500.
Technical Indicators:
The relative strength index (14): at 45 indicating a neutral
The ultimate oscillator: at 58.23 indicating a BUY
High/lows: at 0.0 indicating a neutralThe average directional change (14 days): at 17.86 indicating a neutral
FXOpen offers the world's most popular cryptocurrency CFDs*, including Bitcoin and Ethereum. Floating spreads, 1:2 leverage — at your service (additional fees may apply). Open your trading account now or learn more about crypto CFD trading with FXOpen.
*Important: At FXOpen UK, Cryptocurrency trading via CFDs is only available to our Professional clients. They are not available for trading by Retail clients. To find out more information about how this may affect you, please get in touch with our team.
This article represents the opinion of the Companies operating under the FXOpen brand only. It is not to be construed as an offer, solicitation, or recommendation with respect to products and services provided by the Companies operating under the FXOpen brand, nor is it to be considered financial advice.
Stay ahead of the market!
Subscribe now to our mailing list and receive the latest market news and insights delivered directly to your inbox.


Latest articles

Silver Attempts to Break Out of Its Range
Silver continues to balance between its dual role as an industrial metal and so-called refuge asset, and this combination largely explains the lack of a clear trend in recent weeks. Shifting expectations for central bank interest rates can influence the

Nasdaq 100: Is This the Correction Traders Have Been Waiting For?
The Nasdaq 100 (US Tech 100 Mini on FXOpen) remains caught between two opposing forces: cooling inflation on one side, and persistent geopolitical instability on the other. On 14 July, June's CPI print came in softer than expected, easing near-term

XRP/USD: Symmetrical Triangle Forms as Trading Volume Fades
On 6 July, Ripple received a full Crypto-Asset Service Provider (CASP) licence under the Markets in Crypto-Assets (MiCA) regulation from Luxembourg's financial regulator, the CSSF. The approval allows the company to offer regulated crypto payment services across all 30 countries