


BTCUSD and XRPUSD Technical Analysis – 28th FEB 2023
FXOpen
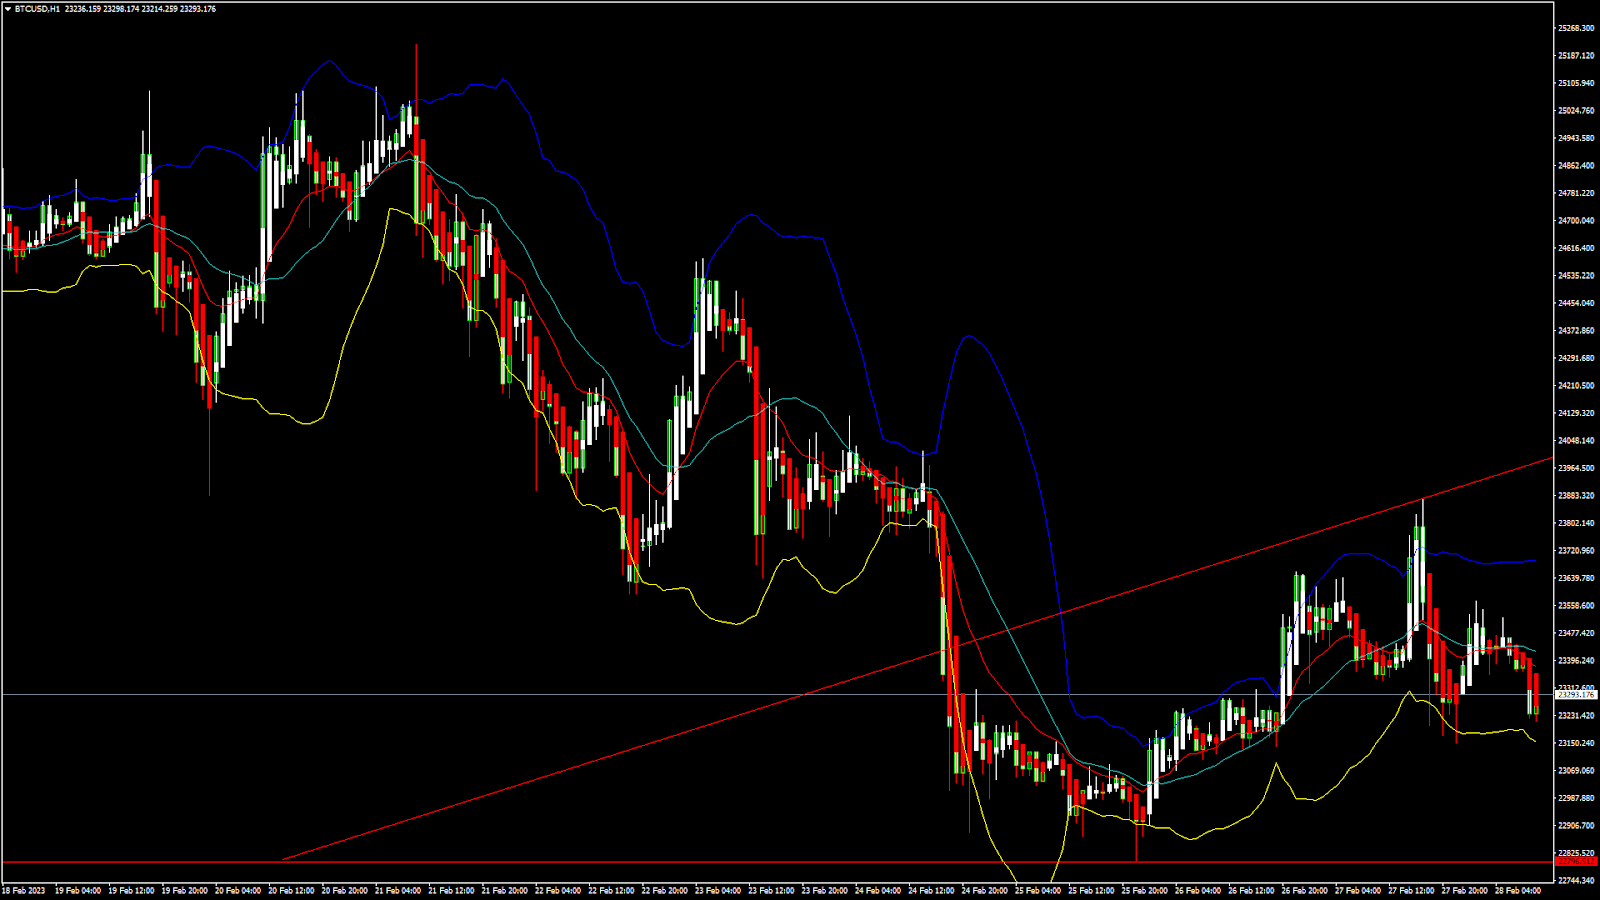
BTCUSD: Bullish Doji Star Pattern Above $22796
Bitcoin was unable to sustain its bearish momentum last week and after touching a low of $22796 on 25th Feb the prices started to correct upwards against the US dollar, touching a high of $23873 on 27th Feb.
We have seen a bearish opening of the markets this week.
We can clearly see a bullish Doji star pattern above the $22796 handle which is a bullish reversal pattern because it signifies the end of a downtrend and a shift towards an uptrend.
Bitcoin touched an intraday high of 23557 in the Asian trading session, and an intraday low of 23214 in the European trading session today.
We can see that the MACD indicator is back over zero in the weekly time frame indicating bullish trends.
The price of bitcoin is ranging near horizontal support in the weekly time frame indicating a bullish trend.
Both the STOCH and STOCHRSI are indicating Overbought levels which means that in the immediate short term, a decline in the prices is expected.
The price of bitcoin is ranging near the support of the channel in the 15-minute time frame indicating a bullish scenario.
The relative strength index is at 55.00 indicating a strong demand for bitcoin, and the continuation of the buying pressure in the markets.
Bitcoin is now moving below its 100 hourly simple moving average and below its 100 hourly exponential moving averages.
Most of the major technical indicators are giving a buy signal, which means that in the immediate short term, we are expecting targets of 24000 and 25500.
The average true range is indicating less market volatility with a bullish momentum.
- Bitcoin: bullish reversal seen above $22796.
- The Williams percent range is giving an overbought signal.
- The price is now trading just below its pivot level of $23729.
- The short-term range is mildly BULLISH.
Bitcoin: Bullish Reversal Seen Above $22796
The price of bitcoin is now moving into a consolidation channel below the $23500 handle which also means that now we are preparing for the next upwards move in bitcoin towards the $25000 level.
The commodity channel index indicator is giving an oversold signal which indicates a neutral tone in the markets.
Some of the technical indicators are also giving a neutral tone present in the markets.
Bitcoin has resumed its rising trend channel with a positive momentum that is building at levels above the $23110.
The immediate short-term outlook for bitcoin is strongly bullish, the medium-term outlook has turned bullish, and the long-term outlook remains neutral under present market conditions.
Bitcoin’s support zone is located at $22711 which is a 14-day RSI at 50% and at $22893 which is a 3-10 day MACD oscillator stalls.
The price of BTCUSD is now facing its classic resistance level of 24948 and Fibonacci resistance level of 26119 after which the path towards 27000 will get cleared.
In the last 24hrs, BTCUSD has increased by 0.58% by 135.92$ and has a 24hr trading volume of USD 22.280 billion. We can see a decrease of 2.34% in the trading volume as compared to yesterday, which appears to be normal.
The Week Ahead
We can see that the price of bitcoin is now almost 53% up against the lows formed in November 2022.
The consolidation in the levels of bitcoin also indicates that the global investor sentiment continues to improve and will lead to the higher price of bitcoin in the month of March 2023.
The daily RSI is printing at 50.79 which indicates a neutral demand for bitcoin and the continuation of the bullish phase present in the markets in the short-term range.
We can see the formation of a bullish trend line from $22796 towards the $23989 level.
The price of BTCUSD is now facing its resistance zone located at $24030 at which the price crosses 9-day moving average and $24095 which is a 14-3 day raw stochastic at 70%
The weekly outlook is projected at $24500 with a consolidation zone of $24000.
XRPUSD: The Morning Star Pattern Above $0.3694
Ripple was unable to sustain its bearish momentum last week and after touching a low of $0.3694 on 25th Feb, the price started to correct upwards against the US dollar touching a high of $0.3799 on 20th Feb.
The price of Ripple is ranging near horizontal support of the channel in the daily time frame indicating a bullish trend.
We can clearly see a morning star pattern above the $0.3694 handle which is a bullish reversal pattern because it signifies the end of a downtrend and a shift towards an uptrend.
Ripple touched an intraday high of 0.3799 and an intraday low of 0.3719 in the Asian trading session today.
The Ichimoku bullish crossover – Tenkan and Kijun are seen in the 4-hour time frame.
The relative strength index is at 56.99 which signifies a strong demand for Ripple at the current market prices and the continuation of the bullish phase in the markets.
Most of the moving averages are giving a buy signal at the current market levels of 0.3751.
The average directional index is indicating a neutral level, which means that the prices are expected to enter into a consolidation phase now.
Ripple is now trading just above its pivot level of 0.3749 and facing its classic resistance level of 0.3753 and Fibonacci resistance level of 0.3755 after which the path towards 0.4000 will get cleared.
Most of the major technical indicators are giving a buy signal.
- Ripple: bullish reversal seen above the 0.3694 level.
- The Williams percent range is indicating an overbought market.
- The average true range indicates less volatility.
- Ripple gains bullish bias against the US dollar.
Ripple: Bullish Reversal Seen Above 0.3694

We can see that Ripple is moving in an zigzag pattern with the prices ranging in between the $0.3650 and $0.3850 with a subrange that is indicative of the exhaustion of the selling pressure in the markets.
The Ichimoku – bullish crossover: Tenkan and Kijun are seen which is indicative of a bullish formation in the markets.
We can see the formation of both the bullish harami, and bullish harami cross pattern in the 1-hour time frame.
The commodity channel index, CCI, is giving a bullish divergence which is indicative of a bullish trend in the markets.
The short-term outlook for Ripple has turned bullish, the medium-term outlook is neutral, and the long-term outlook is neutral under present market conditions.
The price of XRPUSD has increased by 0.53% with a price change of $0.001972 in the past 24hrs and has a trading volume of 1.040 billion USD.
We can see an increase of 36.95% in the trading volumes of Ripple compared to yesterday, which is due to the market consolidation seen this week.
This Week Ahead
Ripple is showing early signs of recovery with the formation of the three inside up pattern multiple times in the last 7 days.
Now we are heading towards the $0.3800 handle this week with an upside focus.
There is a major bullish trend line formation with the support located at $0.3604 which is a 38.2% retracement from 13-week high/low.
We can see a continuous progression of a bullish trend line formation from $0.3694 towards the $0.3835 levels.
The support zone is located at $0.3455 at which the price crosses 40-day moving average stalls.
The weekly outlook for Ripple is projected at $0.4000 with a consolidation zone of $0.3900.
FXOpen offers the world's most popular cryptocurrency CFDs*, including Bitcoin and Ethereum. Floating spreads, 1:2 leverage — at your service (additional fees may apply). Open your trading account now or learn more about crypto CFD trading with FXOpen.
*Important: At FXOpen UK, Cryptocurrency trading via CFDs is only available to our Professional clients. They are not available for trading by Retail clients. To find out more information about how this may affect you, please get in touch with our team.
This article represents the opinion of the Companies operating under the FXOpen brand only. It is not to be construed as an offer, solicitation, or recommendation with respect to products and services provided by the Companies operating under the FXOpen brand, nor is it to be considered financial advice.
Stay ahead of the market!
Subscribe now to our mailing list and receive the latest market news and insights delivered directly to your inbox.


Latest articles

AUD/CAD: Months of Indecision — Is a Breakout Finally Coming?
The Australian dollar has clawed back most of its end-of-June losses, when it touched three-month lows against the greenback amid escalating Middle East tensions. Since then, sentiment has improved: the RBA's Assistant Governor Sarah Hunter signalled the board stands ready

USD/JPY: Battling at the Top of the Triangle
On 3 July, Japan's Finance Minister, Satsuki Katayama, stated that the Ministry of Finance remains in close contact with US authorities regarding developments in USD/JPY as the yen traded near its weakest level in almost 40 years. Similar verbal

Dow Jones (DJIA): Consolidation Beyond the Trend
Federal Reserve Chair Kevin Warsh testified before Congress on 14–15 July, reaffirming the Fed's commitment to bringing inflation back to target while providing no clear guidance on the future path of interest rates. Meanwhile, June inflation data came in