


FXOpen

Candlestick patterns offer traders a way to read price action and spot potential changes in momentum. One notable pattern is the evening star, a three-candle formation that signals the start of a possible downtrend. This article breaks down what the evening star looks like, how it works, and how traders typically use it.
What Is the Evening Star Candlestick Pattern?
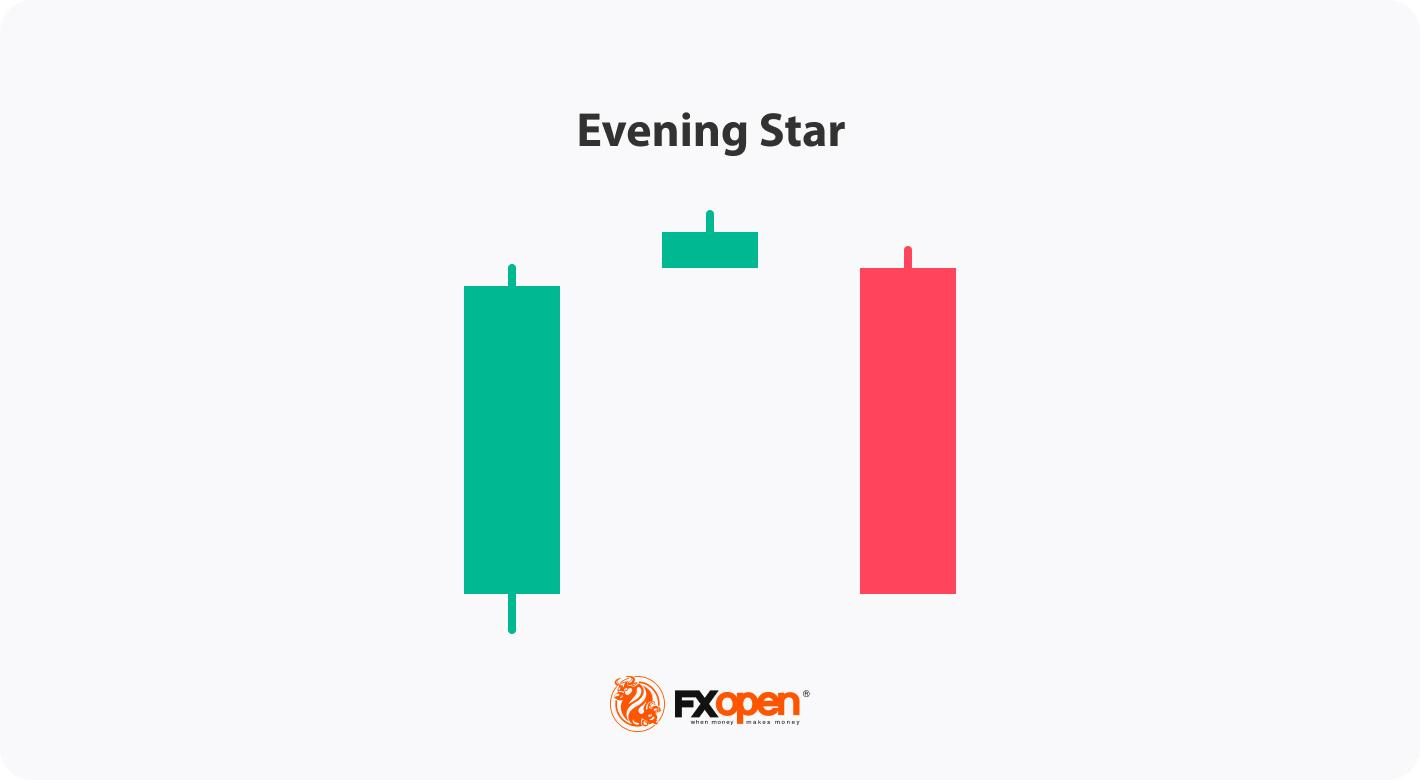
The evening star is a three-candle pattern that traders watch for after a strong upward move. It’s considered a bearish reversal pattern, signalling that bullish momentum is fading. The setup consists of three candles:
- The first candle is a large bullish candle—it shows a clear upward direction.
- The second is much smaller. This middle candle—the star—reflects hesitation. Buyers and sellers are more balanced, and the market’s pace slows.
- The third candle acts as confirmation. It’s a solid bearish candle that closes deep into the body of the first.
The middle candle also often gaps up from the first, especially in stocks or indices, but gaps aren’t essential. What matters is the sequence: strength, indecision, reversal. The further the final candle closes into the body of the first, the stronger the pattern is considered.
Evening stars can appear on any timeframe, but many traders look for them on the daily chart where the signals tend to be clearer. It’s not a pattern to act on blindly—but in the right context, such as after a sustained bullish trend, it’s a useful sign that buyers might be losing control.
The Psychology Behind the Evening Star
It’s always useful to frame the formations like the evening star candle pattern in the context of market psychology.
Here, the first bullish candle signals buyer confidence. They drive prices higher and the candle closes strongly. The next candle is smaller, suggesting that momentum is slowing. Buyers aren’t pushing as hard, and sellers start to step in.
When the third candle closes strongly bearish, it confirms that sentiment is changing. Sellers are now in control, and previous buying strength fades. This shift often happens at the end of an extended upward movement, where fewer buyers are willing to bid the price up and begin closing positions.
How Traders Use the Evening Star Candlestick Formation
The evening star can be a useful part of a trader’s toolkit, especially when it lines up with other pieces of analysis.
Opening and Closing a Trade
The evening star pattern candlesticks become more meaningful when they appear around known areas of resistance or previous swing highs. If the market’s been edging closer to a clear level—like a horizontal resistance line, Fibonacci retracement, or trendline—and then an evening star forms, it can add weight to the idea that the rally is weakening. Some traders also watch for patterns forming near round numbers or psychological price points.
If traders notice an evening star pattern occurring at a resistance level, they typically look for confluence using another indicator. The RSI might signal a bearish divergence, the price may be piercing an upper Bollinger Band, or it could also be bouncing from a 200-period EMA. Volume can be another factor—rising volume on the third candle can signal more participation behind the selling.
Explore 1,200+ trading tools in FXOpen’s free TickTrader trading platform.
Once a trader has confidence that a bearish reversal is likely underway, they often use the candles following the third candlestick as an entry trigger. A stop loss might be set above the middle candle’s high, while take-profit targets might be placed at an area where a bullish reversal might occur, like a support level. Some might simply trail a stop to take advantage of the strong downtrend or exit when an indicator/candlestick pattern signals that bearish momentum is fading.
Marking Potential Trend Shifts
Some traders use the evening star to flag potential trend exhaustion. While they may not act on the signal (e.g. they are bullish overall and not willing to take shorts yet), the presence of an evening star can suggest the uptrend is vulnerable. They may prepare to buy a pullback, partially close an existing long position, or start watching for further bearish signals.
Example Trades
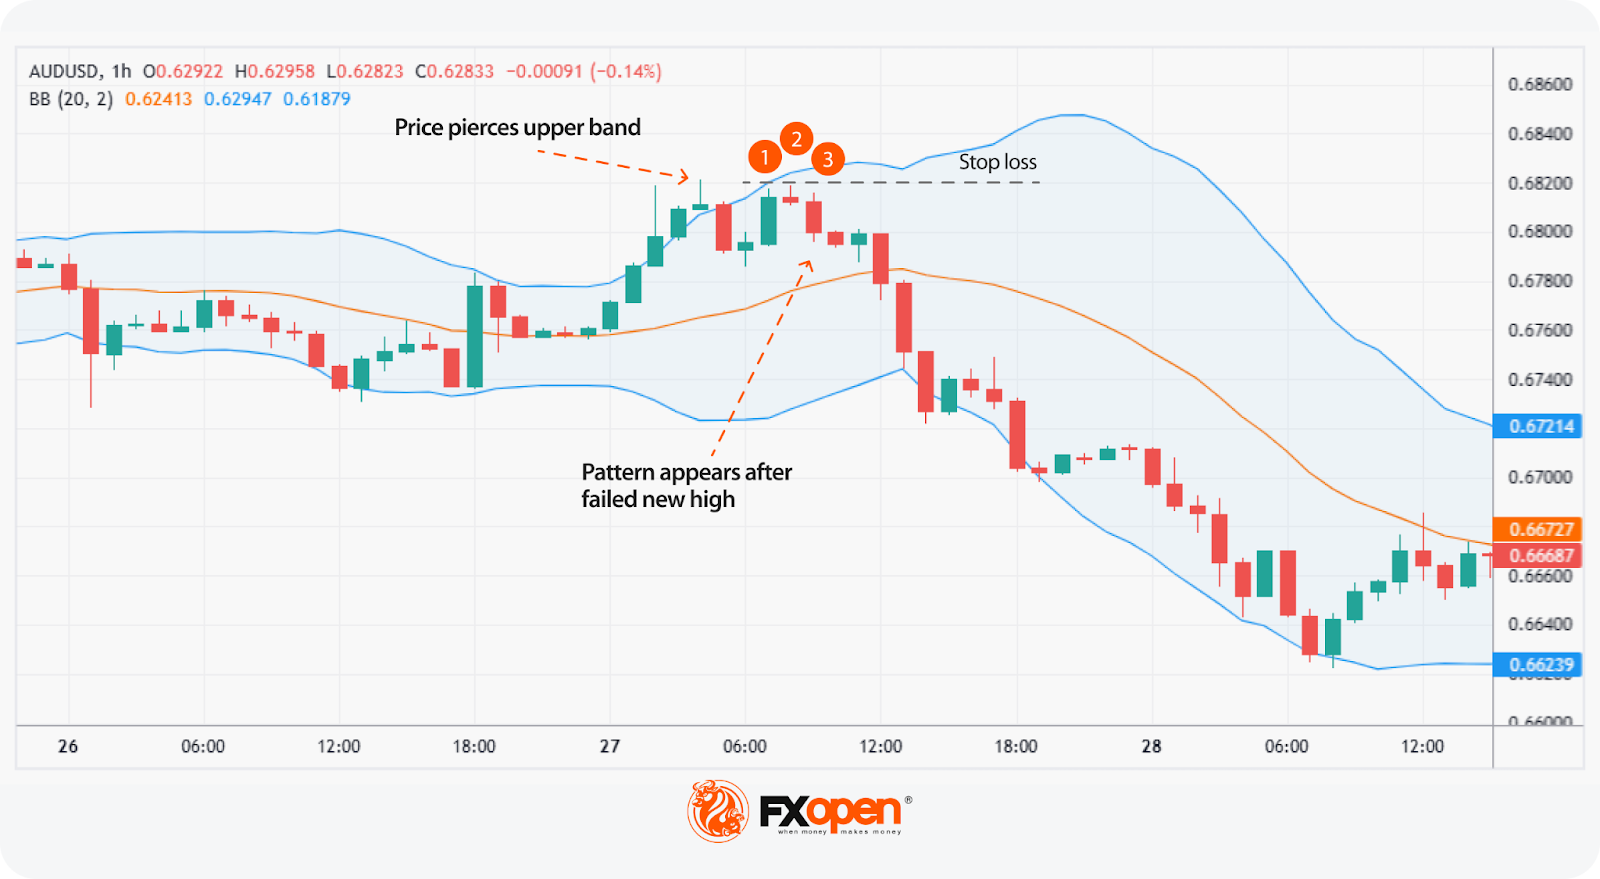
In the example above, we see a slight rally in AUD/USD in a broader downtrend (off-screen). Price initially pierces the upper Bollinger Band, with slight rejections visible in the upper wicks. After a brief dip, the market retests highs and finds resistance. At this point, the pattern forms, with confirmation coming from relatively weak candles afterwards. Price then closes through the midline of the Bollinger Bands, providing full confirmation of a bearish reversal.
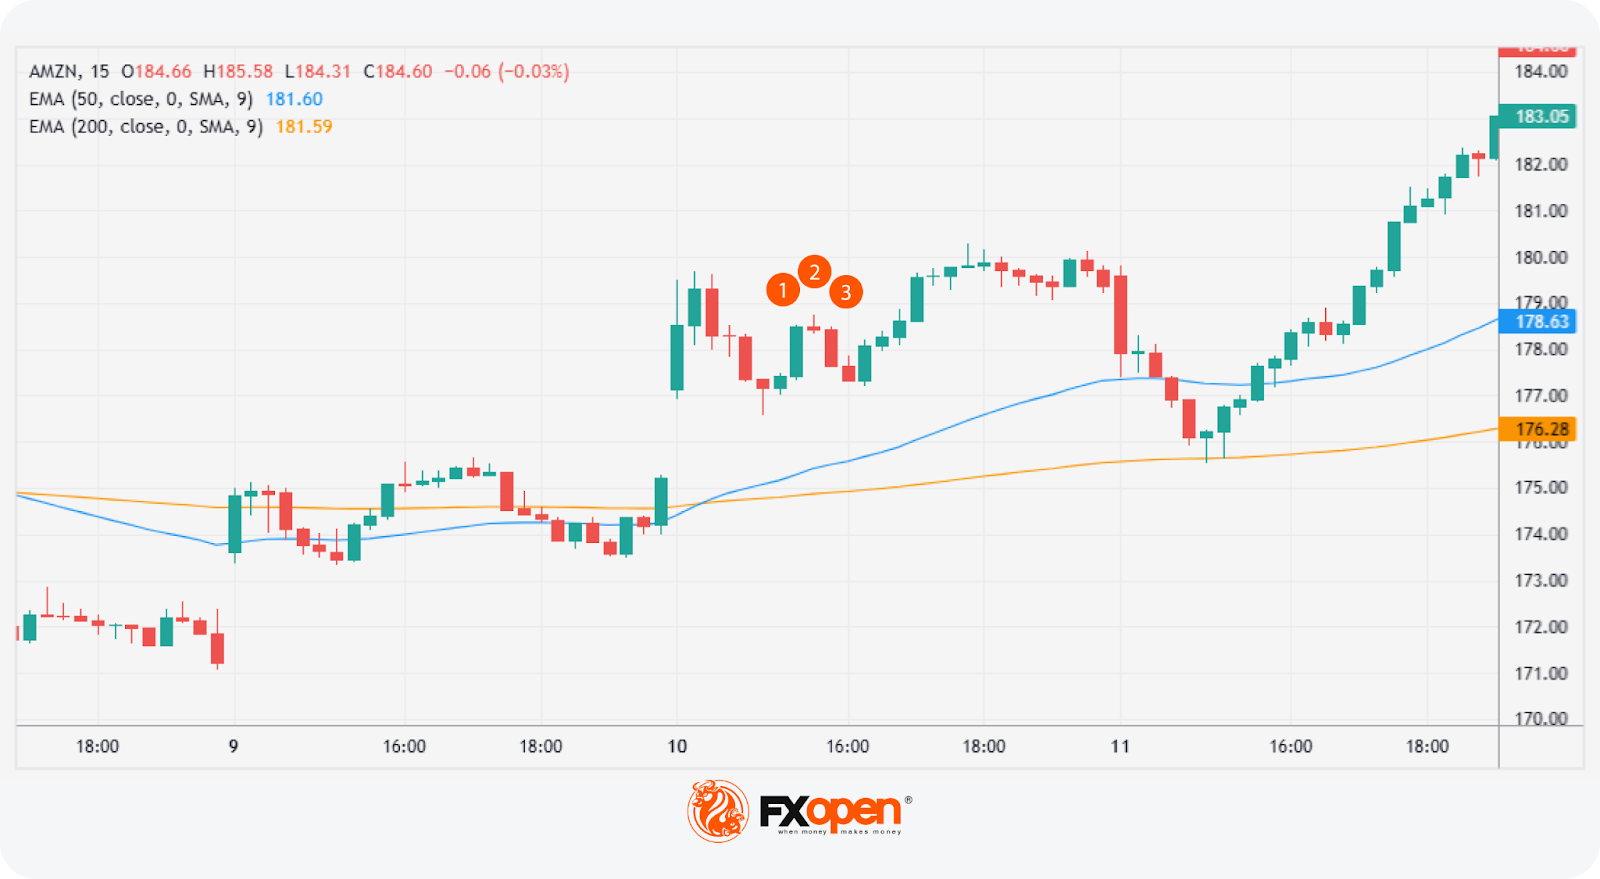
In this second example, we can see a failed evening star. Here, Amazon (AMZN) gaps up over two consecutive days. That leads the 50-period EMA to slope up and cross above its 200-period counterpart—a clear bullish signal.
In this context, it may be better to ignore the signal. The market continues to move higher in an uptrend with consecutive bullish gaps, confirmed by the EMA crossover, indicating a lower probability the pattern will work successfully. Like any pattern, the evening star is expected to be more reliable when contextual factors align, such as in the AUD/USD example.
Strengths and Limitations of the Evening Star
The evening star has its strengths and limitations. To rely on the evening star in trading, it’s worth being aware of both sides.
Strengths
- Clear visual structure: The three-candle formation is straightforward, especially on higher timeframes.
- Logical: The pattern reflects an evident change in momentum that shifts from buying to selling pressure.
- Useful in a wider toolkit: When combined with other forms of analysis (resistance levels, overbought signals, strong volume), it can help traders pinpoint potential turning points and offer an entry.
Limitations
- Requires confirmation: On its own, the pattern doesn’t confirm a downtrend. It’s a potential signal, but not a guarantee.
- Less reliable in choppy markets: In sideways or low-volume markets, evening stars usually produce false signals.
- Subject to interpretation: Candle size, wicks, and placement can vary, which means not every setup is clean or tradable.
Comparison with Other Candlestick Patterns
The evening star is one of many bearish reversal patterns, meaning it’s easy to get mixed up. Here’s a brief look at some of its most similar formations:
Evening Doji Star
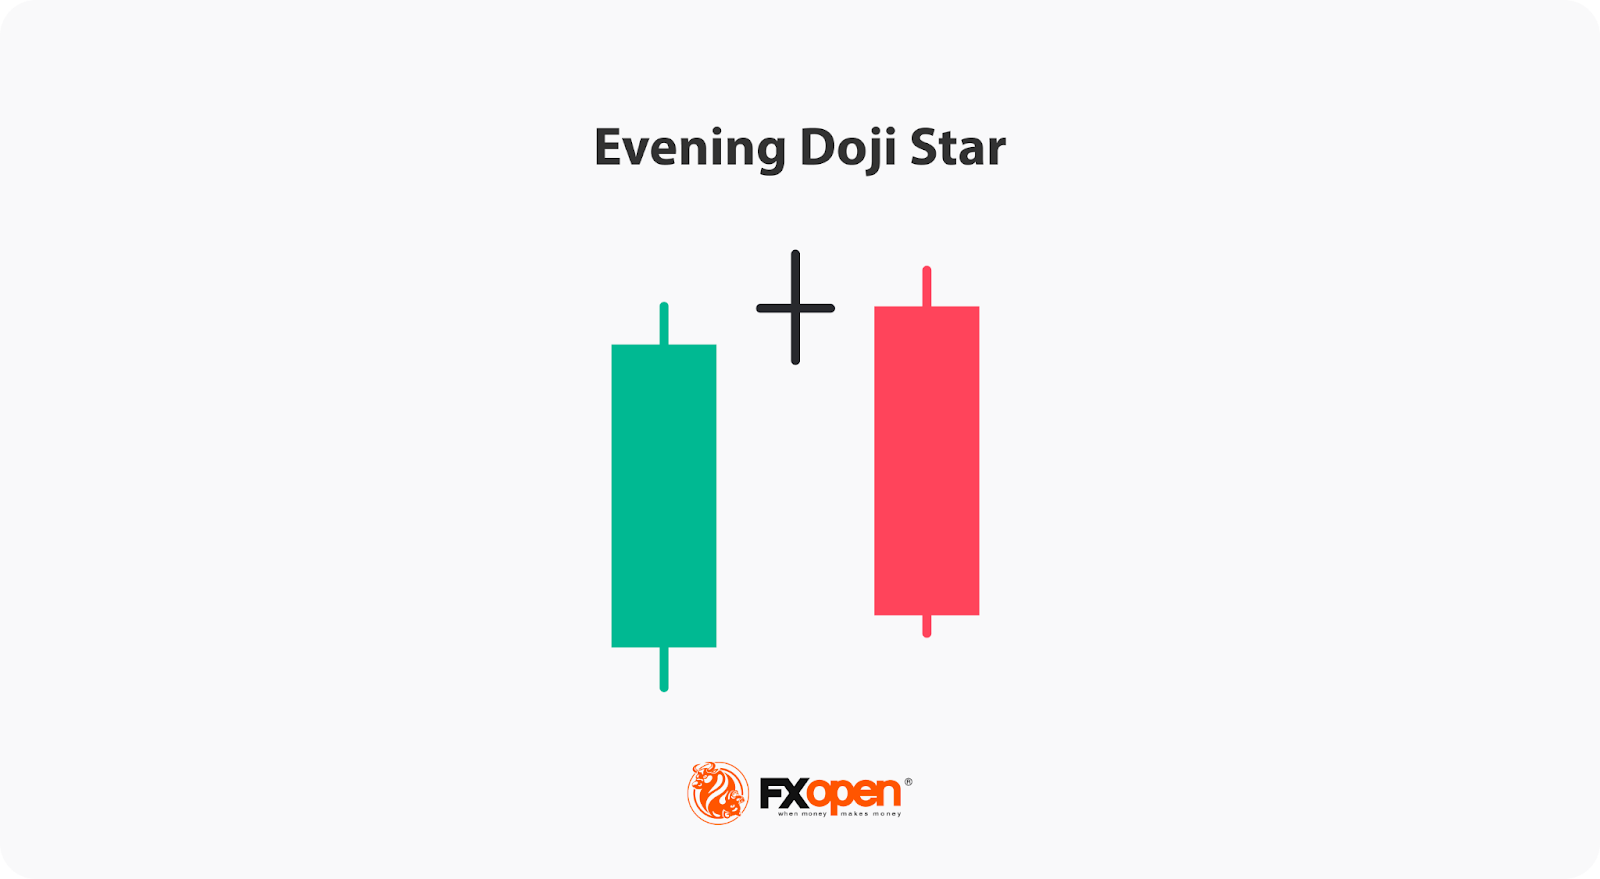
This is a variation of the evening star where the middle candle is a doji—a candle with almost no body. The evening star doji variant reflects even stronger indecision than a regular small-bodied candle. Some traders view this version as more significant, especially when the third candle confirms the reversal with a solid bearish close.
Morning Star
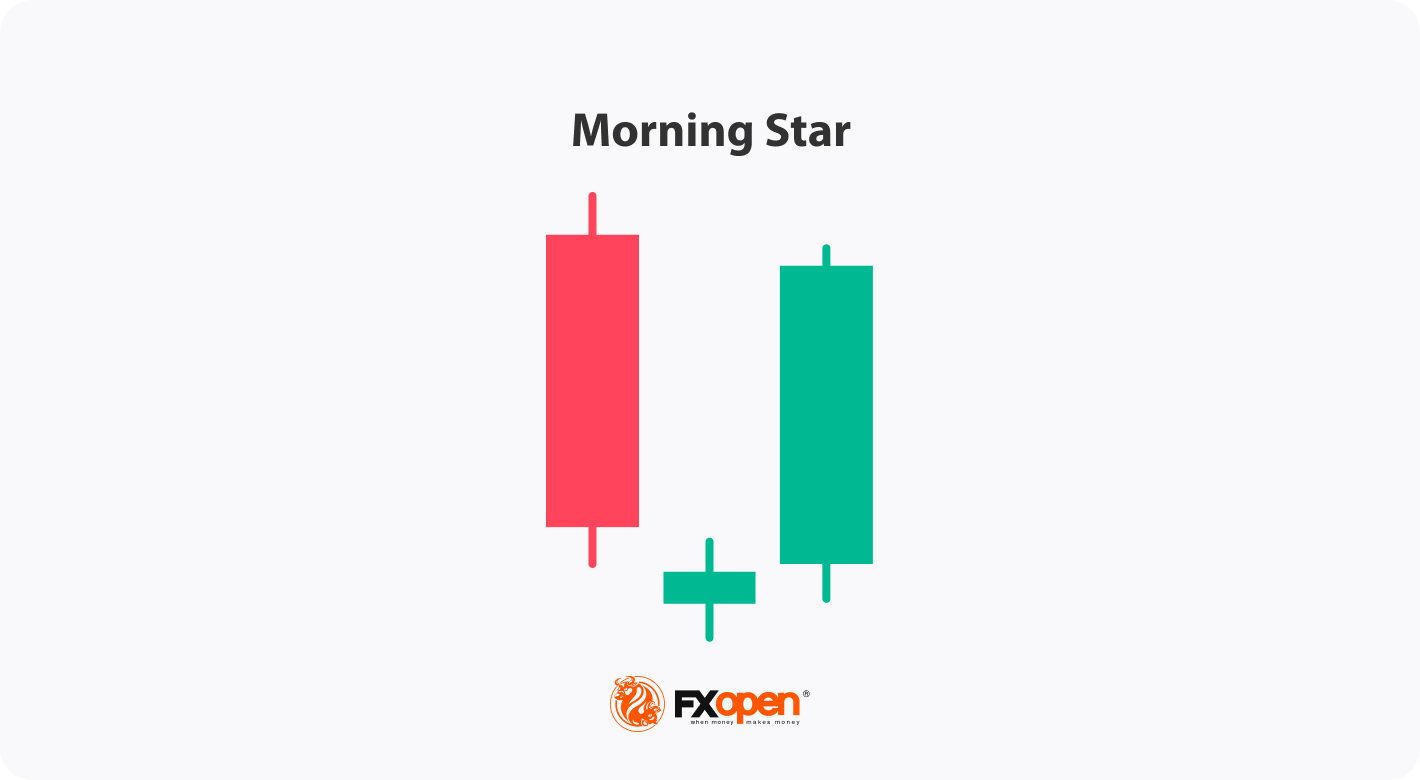
The morning star is the bullish version of the evening star, forming after a downtrend and signalling a new potential bullish trend. Structurally, it’s the same—three candles with the middle one showing hesitation and the third moving strongly in the opposite direction. It captures a similar shift, but from bearish to bullish.
Shooting Star
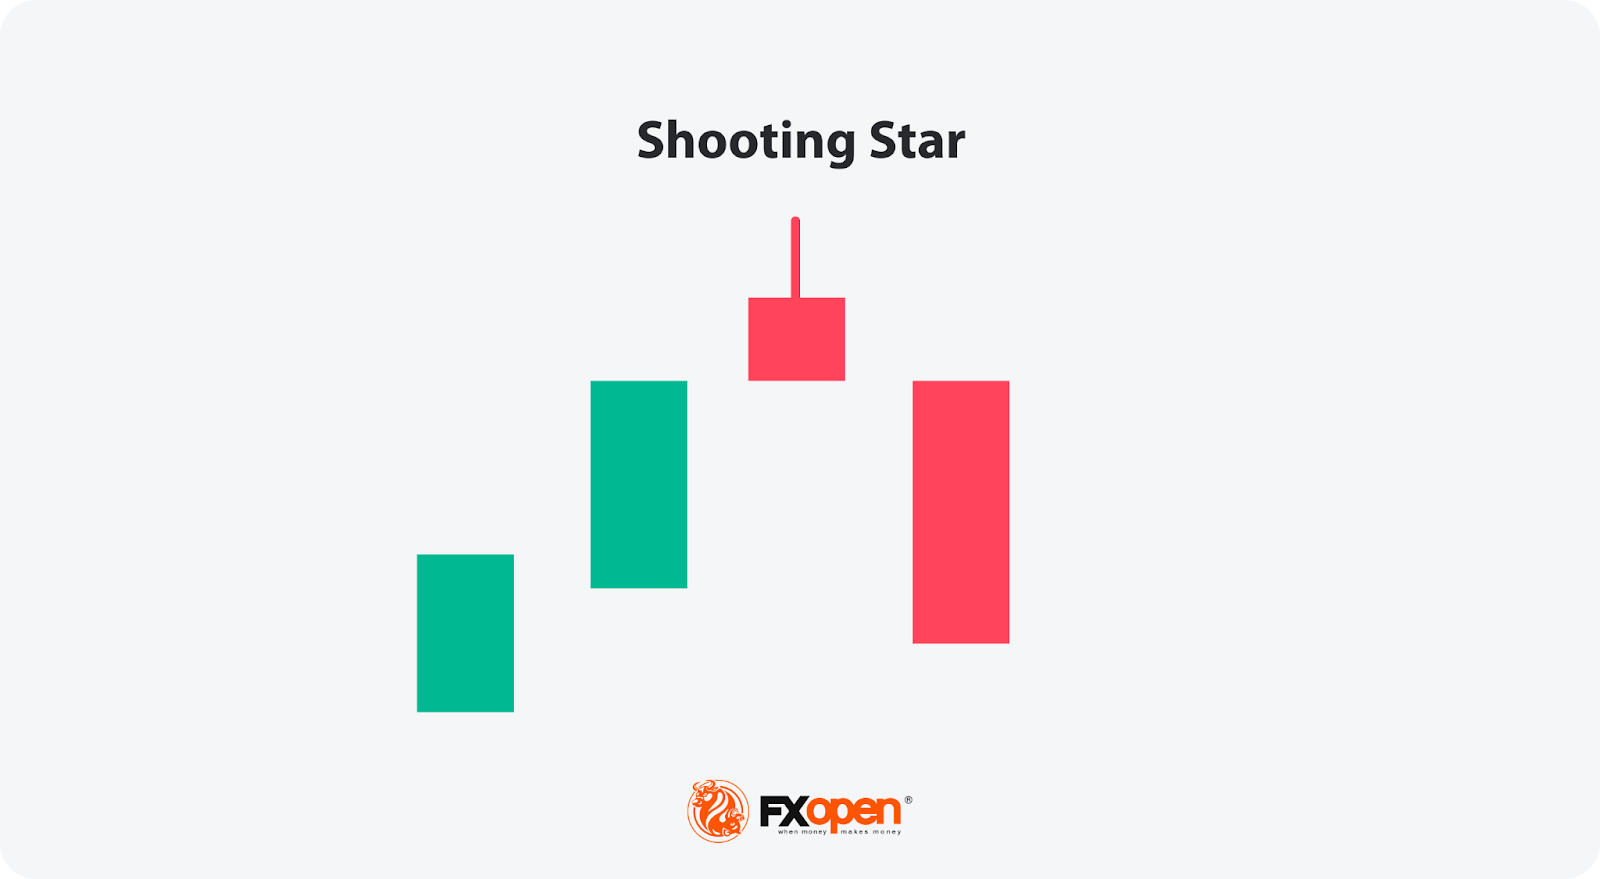
The shooting star is a single-candle pattern that appears after an uptrend. It has a small body near the bottom, a long upper wick, and little or no lower wick, signalling clear rejection of higher prices.
Unlike the evening star, which plays out over three candles, the shooting star is faster but can be less reliable without confirmation from the next candle.
Hanging Man
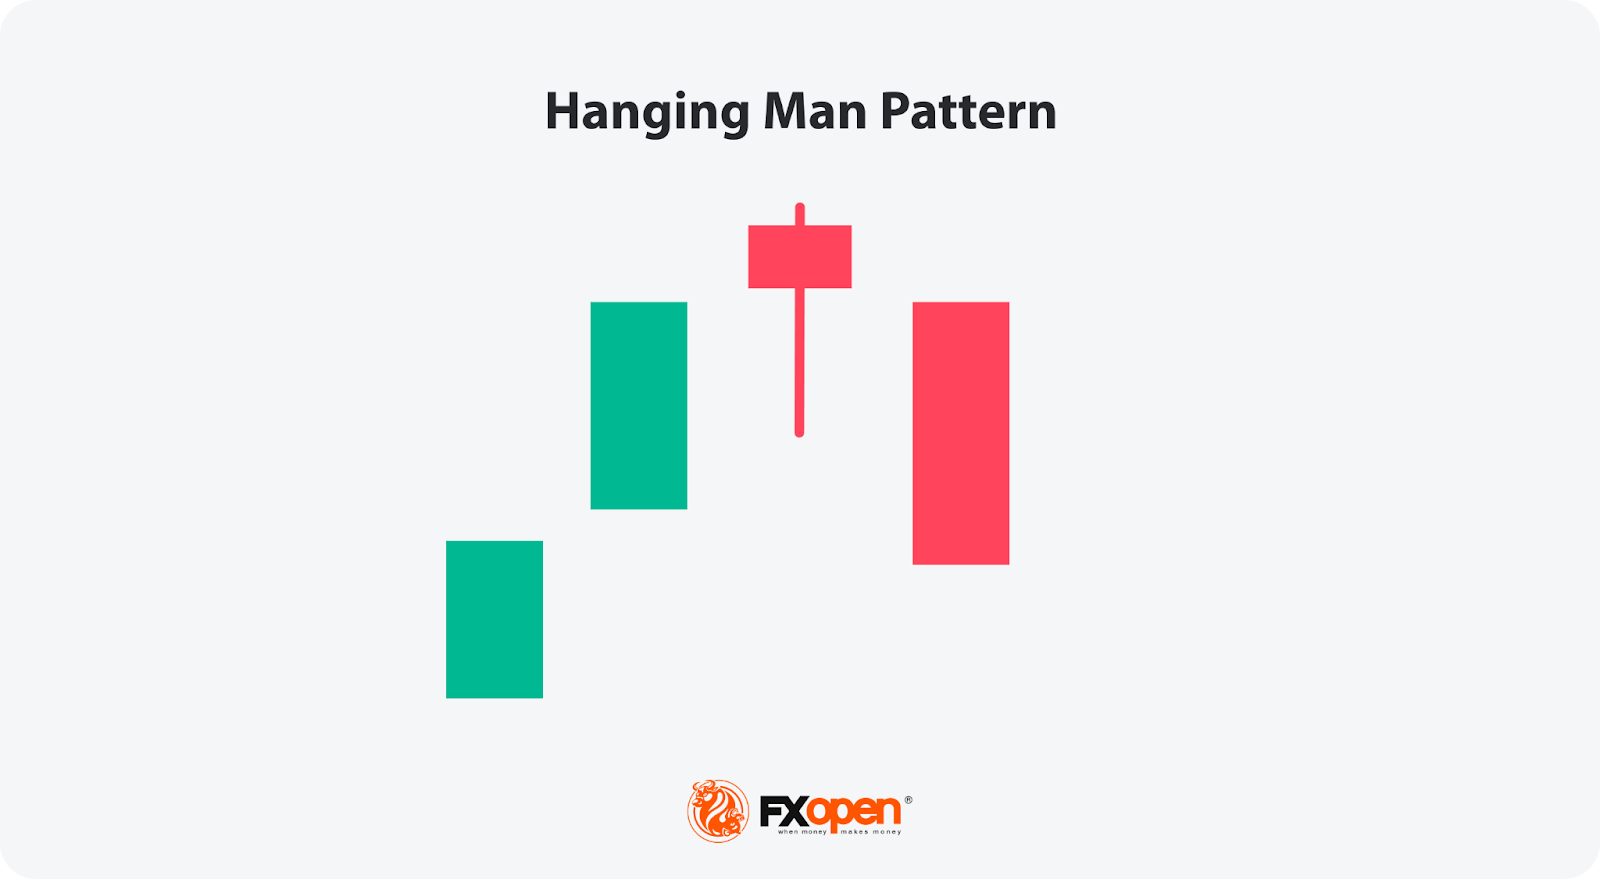
The hanging man consists of just a single candle at the peak of an uptrend, featuring a small body with a long lower wick and a small or non-existent upper wick. Like the evening star, it suggests weakening buying pressure and sellers stepping in, but it lacks a clear multi-candle structure and typically requires greater confirmation.
The Bottom Line
The evening star pattern offers traders a structured way to identify potential turning points in the market. Its three-candle formation makes it popular among those seeking greater confirmation than single-candle patterns. To put the evening star knowledge into practice across more than 700 live markets, consider opening an FXOpen account and trade with tight spreads and low commissions on any of four advanced trading platforms.
FAQ
What Does an Evening Star Candle Pattern Mean?
It’s a three-candle formation that appears at the end of a solid uptrend. An evening star in trading indicates a potential bearish reversal or a short-term downward movement depending on market conditions and the timeframe used.
Is the Evening Star Bullish or Bearish?
The evening star is considered a bearish pattern that shows buyer exhaustion. A third long bearish candle reflects a change in the market sentiment.
How Do an Evening Star and a Hanging Man Differ?
The evening star is a three-candle pattern showing a gradual change in momentum. The hanging man is a single-candle pattern, with a small body and long lower wick. Both are bearish reversal signals, but the hanging man typically requires greater confirmation.
How Do a Shooting Star and an Evening Star Differ?
The shooting star is a one-candle pattern with a long upper wick and a small body that signals rejection at higher prices. The evening star is a three-candle pattern. Both formations reflect a shift from bullish to bearish sentiment.
This article represents the opinion of the Companies operating under the FXOpen brand only. It is not to be construed as an offer, solicitation, or recommendation with respect to products and services provided by the Companies operating under the FXOpen brand, nor is it to be considered financial advice.
Stay ahead of the market!
Subscribe now to our mailing list and receive the latest market news and insights delivered directly to your inbox.


Latest articles


Market Insights with Gary Thomson: Oil, US Retail Sales & NFP in Focus
In this video, we’ll explore the key economic events and market trends, shaping the financial landscape. Get ready for insights into financial markets to help you navigate the week ahead. Let’s dive in!
In this episode of Market

Geopolitics Fuels Volatility: AUD/USD and USD/CAD Near Key Levels
Commodity-linked currencies continue to weaken amid rising geopolitical tensions, which are boosting demand for safe-haven assets and increasing volatility across both FX and commodity markets. The US dollar is gaining support from demand for liquid and defensive assets, while currencies