


Chaikin Money Flow Indicator: How to Measure Market Pressure
FXOpen
Are you looking for a way to gauge the momentum of buying and selling pressure in the financial markets? Then you may want to learn about the Chaikin Money Flow (CMF) indicator. In this article, we’ll take a closer look at this effective indicator, including its formula, interpretation, and how to use it in a trading strategy.
What Is the Chaikin Money Flow Indicator?
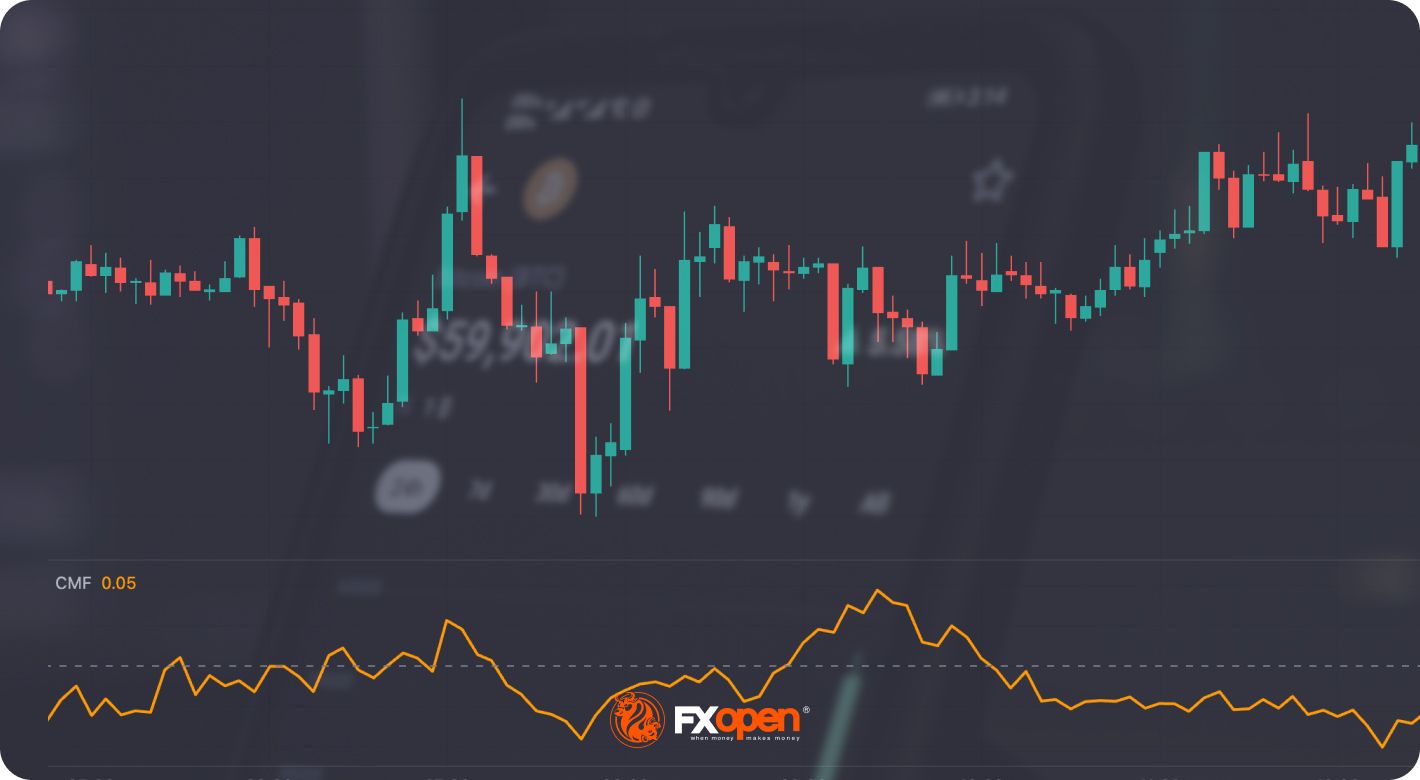
The Chaikin Money Flow (CMF) indicator is an oscillator that measures the strength of buying and selling pressure on a given asset. It was created in the 1980s by Marc Chaikin to provide traders with a better understanding of the flow of money in and out of the market.
The CMF indicator is based on the concept of the Accumulation Distribution Line, which calculates an asset’s total accumulation and distribution over a given period. It then applies the concept of volume-weighted price, which considers the volume traded at each price over a period to determine the strength of buying and selling pressure.
The CMF indicator ranges from -1 to +1, with values above zero indicating buying pressure and values below zero indicating selling pressure. Traders use the CMF to identify trends and potential reversals, as well as to confirm the strength of price movements.
What is the CMF in stocks? It is the same indicator as in forex, commodities, and cryptocurrencies*.
Chaikin Money Flow Formula
Compared to other indicators, the CMF has a slightly more complicated formula with multiple steps. They are as follows:
1. Calculate the Money Flow Multiplier
To determine the money flow multiplier at a given point in time, we use:
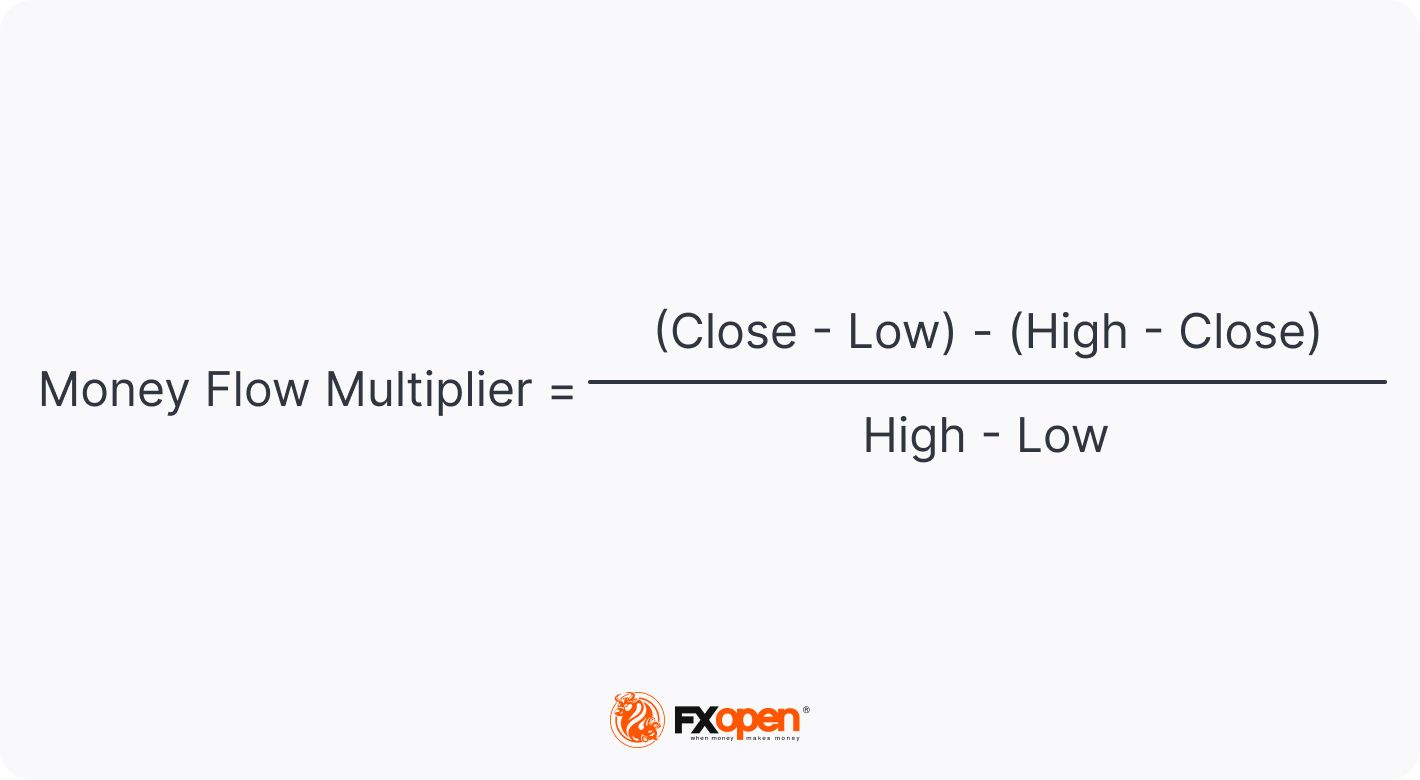
This multiplier is positive when the price closes in the upper half of the period’s high-low range and negative when it closes below the lower half.
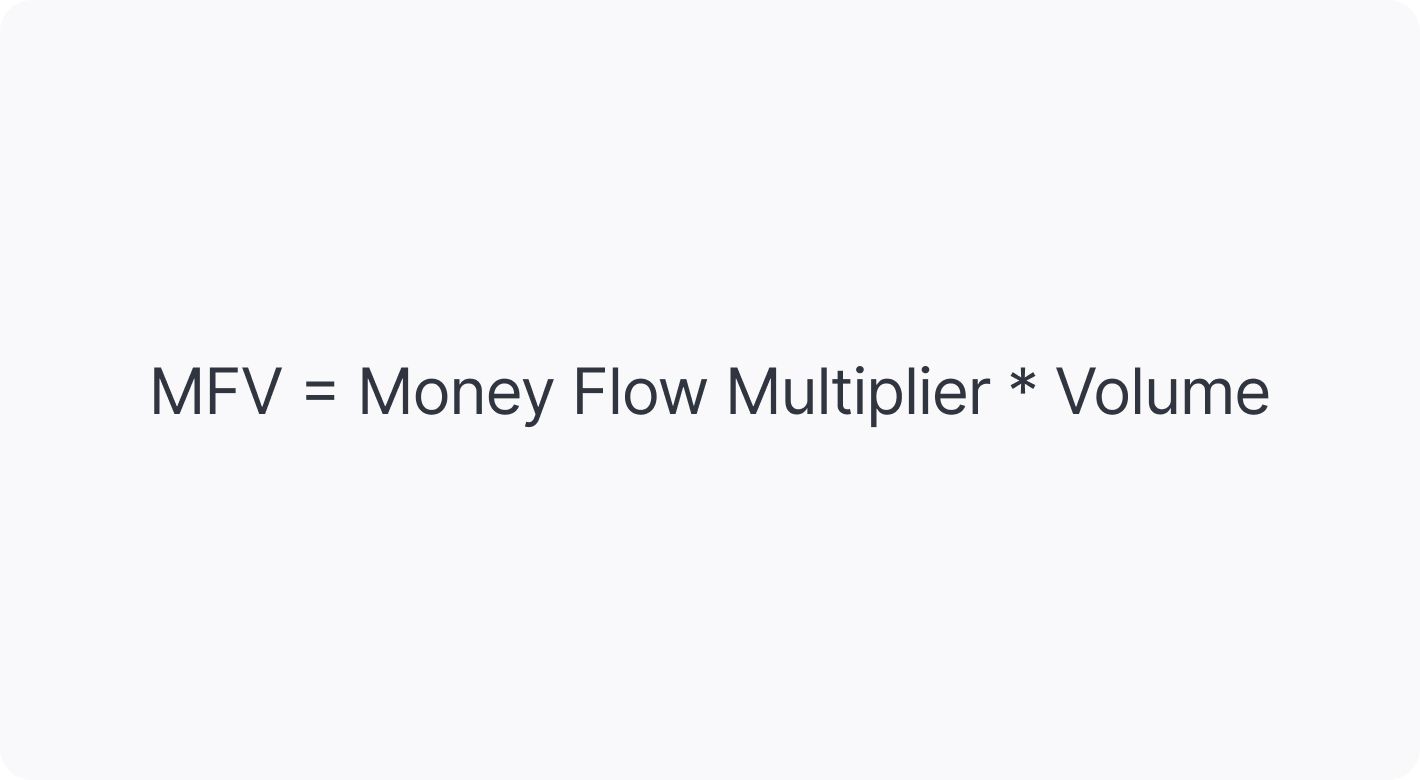
2. Calculate the Money Flow Volume:
The money flow volume (MFV) is calculated by:
3. Calculate CMF:
To work out the final CMF value, we do the following:
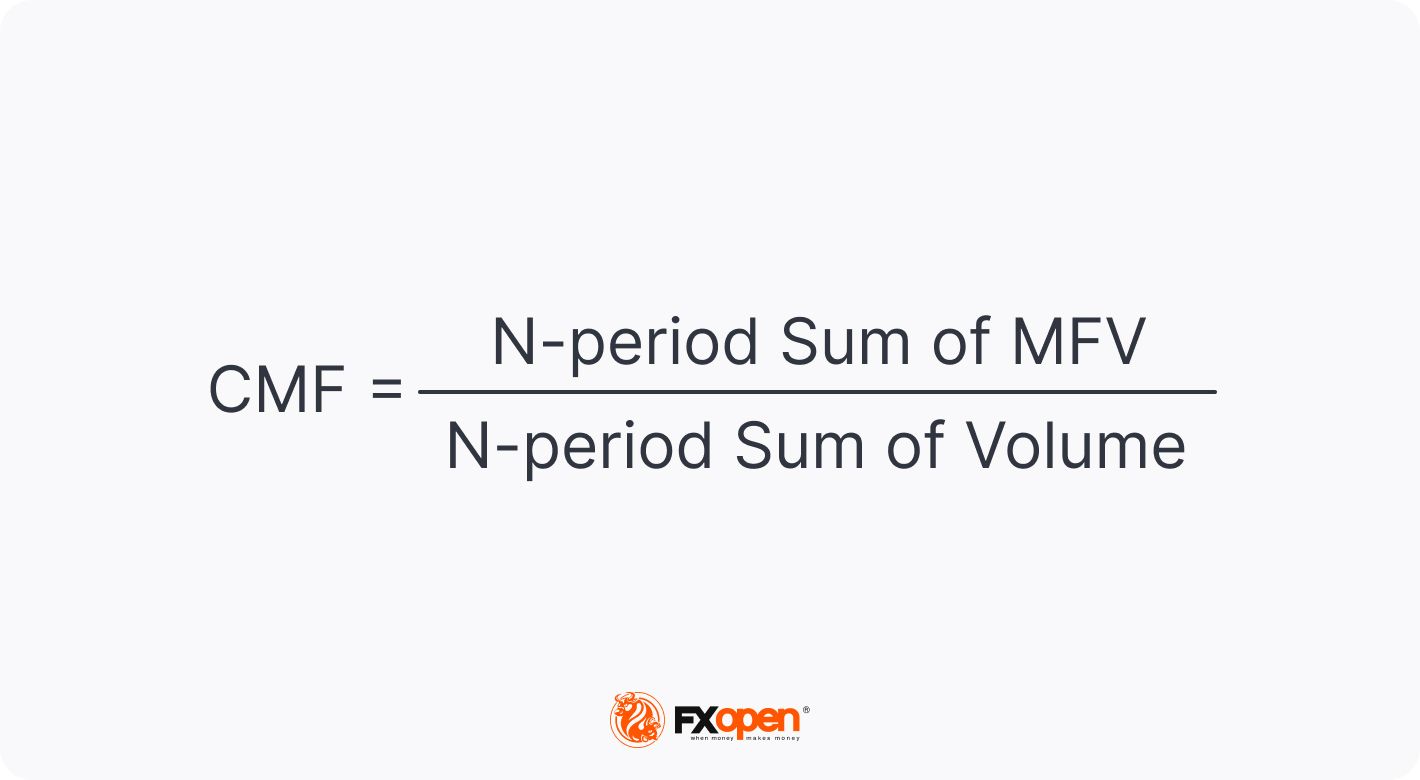
Here, N is typically 20 or 21 periods, although it can be adjusted up or down according to the trader’s preferences.
Thankfully, most charting software includes the CMF indicator, so you don’t need to perform this calculation yourself. In the free TickTrader terminal offered by us at FXOpen, you’ll find the CMF indicator alongside dozens of others ready to help you find your edge in the markets.
How to Interpret Chaikin Money Flow
Now, let’s take a look at how to read the CMF indicator.
Trend Strength
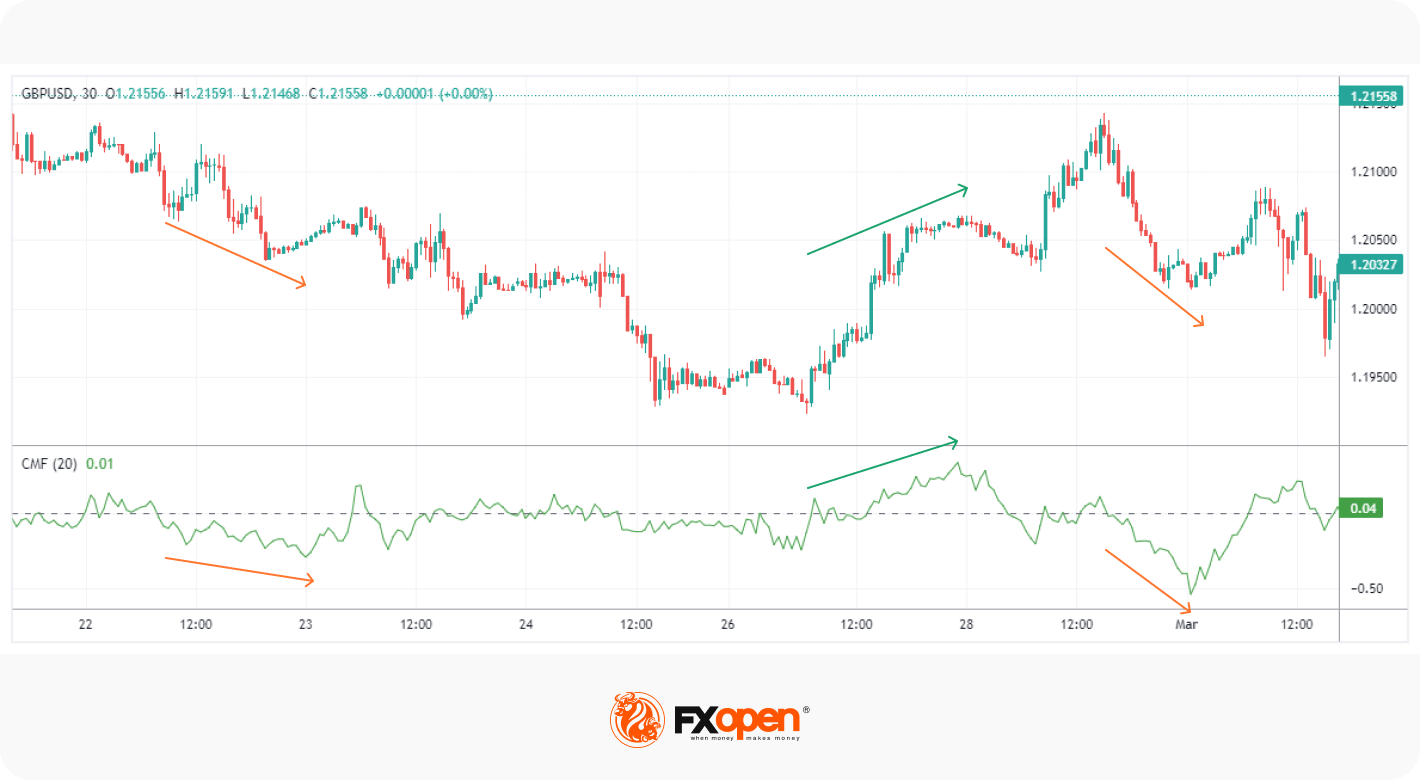
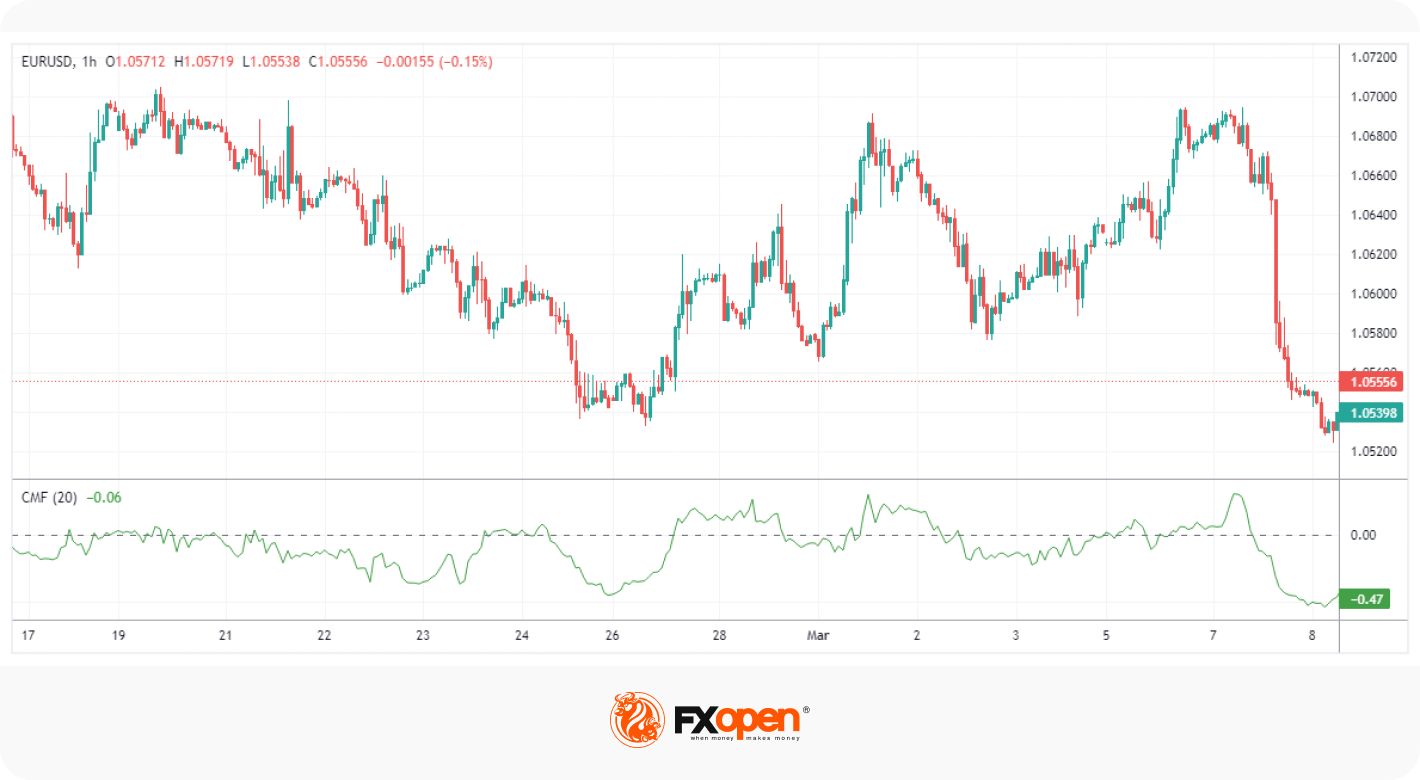
As mentioned, the CMF fluctuates between -1 and +1, but it’s rare for the oscillator to ever cross the -0.5 and +0.5 levels. Regardless, traders can look for movements above and below the 0 midpoint line to determine the direction and strength of a trend.
For example, crosses above 0 indicate buying momentum is entering the market. As the reading climbs higher, so does the buying pressure. The opposite is true if the oscillator crosses below 0.
However, in practice, the indicator will frequently move above and below 0 in a whipsaw-type fashion. Some traders will get around this by only considering moves above or below 0.05 and -0.05 valid signals. This can help filter out the noise and reduce the chance of false signals.
Trend Reversal

Lastly, the CMF indicator can be used to spot potential reversal points in the market. Like other oscillators, traders can look for divergences between the price and the direction of the indicator. For instance, a bullish divergence occurs when the price makes a lower low while the CMF makes a higher low; this could be a sign that the market is reversing bullishly. A bearish divergence appears when the price sets higher highs, but the indicator doesn’t follow it.
It’s also possible to spot hidden divergences using the CMF. A bullish hidden divergence occurs when the price makes a higher low while the oscillator makes a lower low. This signal demonstrates that the price is likely to continue on a bullish trend. For a bearish hidden divergence, we’d look for the price to make a lower high while the oscillator sets a higher high.
Breakout Trading
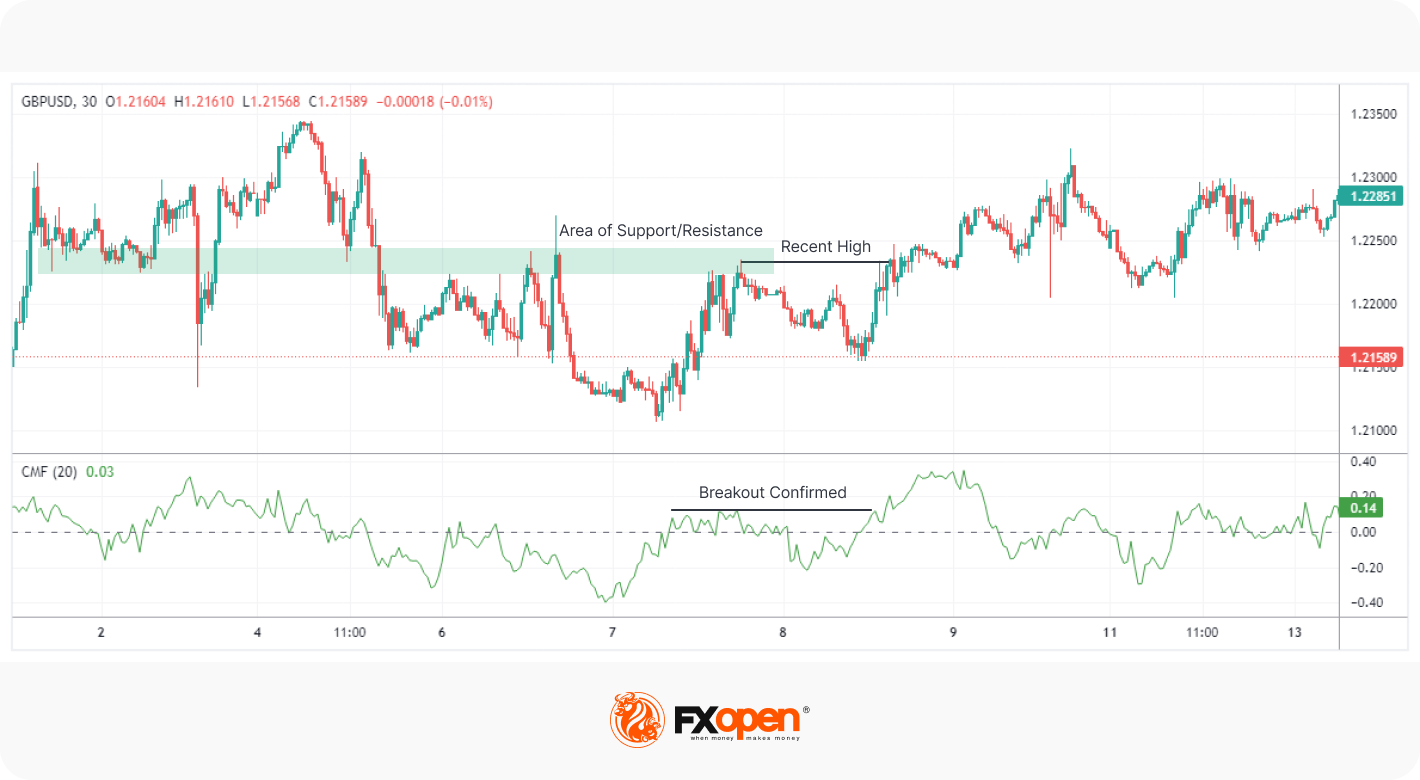
In addition to spotting and gauging trends, the CMF can be used to identify breakouts. If the price is making a new high and breaking through resistance, traders often look for the CMF to break above previous peaks. The opposite is applied when the price breaks below the support level.
Using the CMF Indicator in a Strategy
Ultimately, the CMF indicator is a powerful tool, but it shouldn’t be used in isolation. Instead, it should be combined with other forms of technical analysis, whether they be support/resistance, chart patterns, or additional unrelated indicators.
In this example, we’ll use a moving average crossover combined with a filtered CMF to spot potential entries.
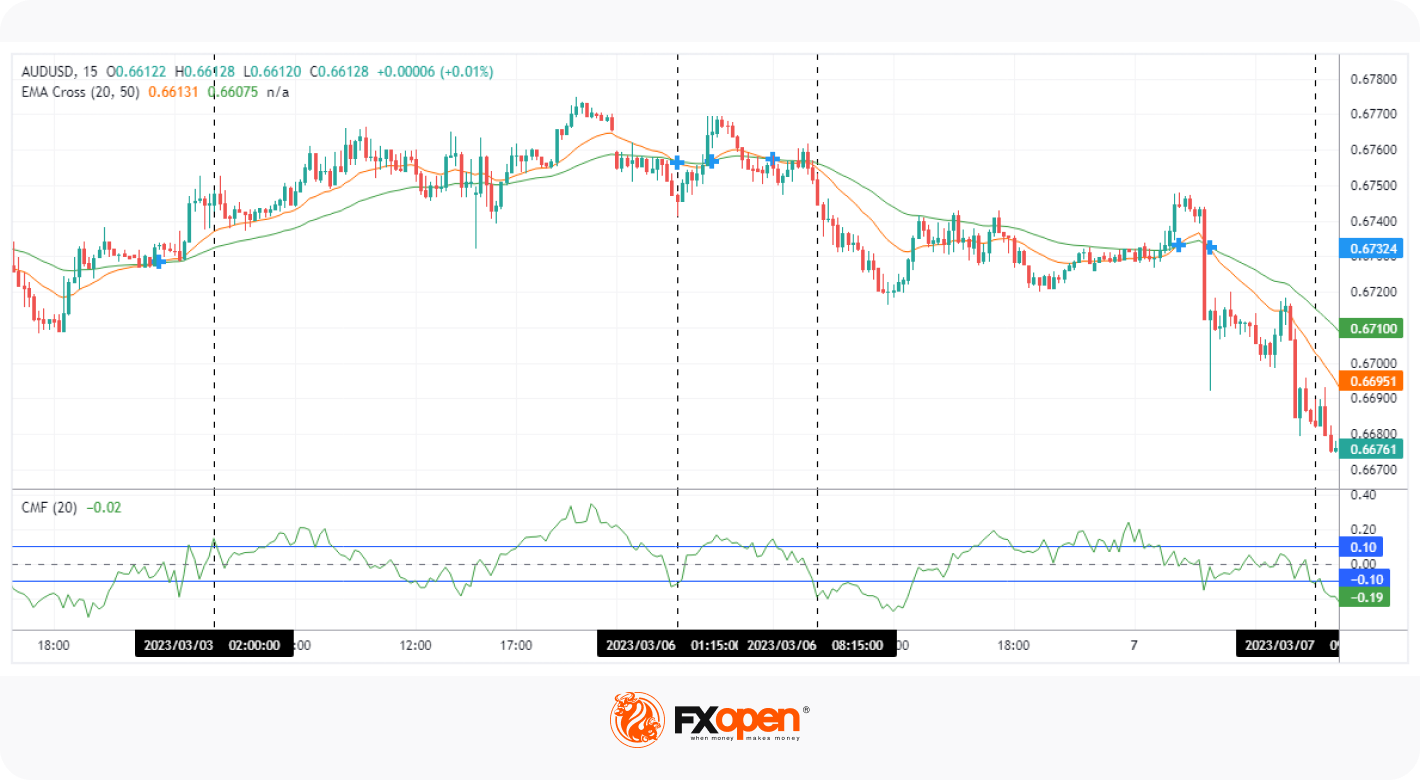
Step 1: Set Up Your Chart
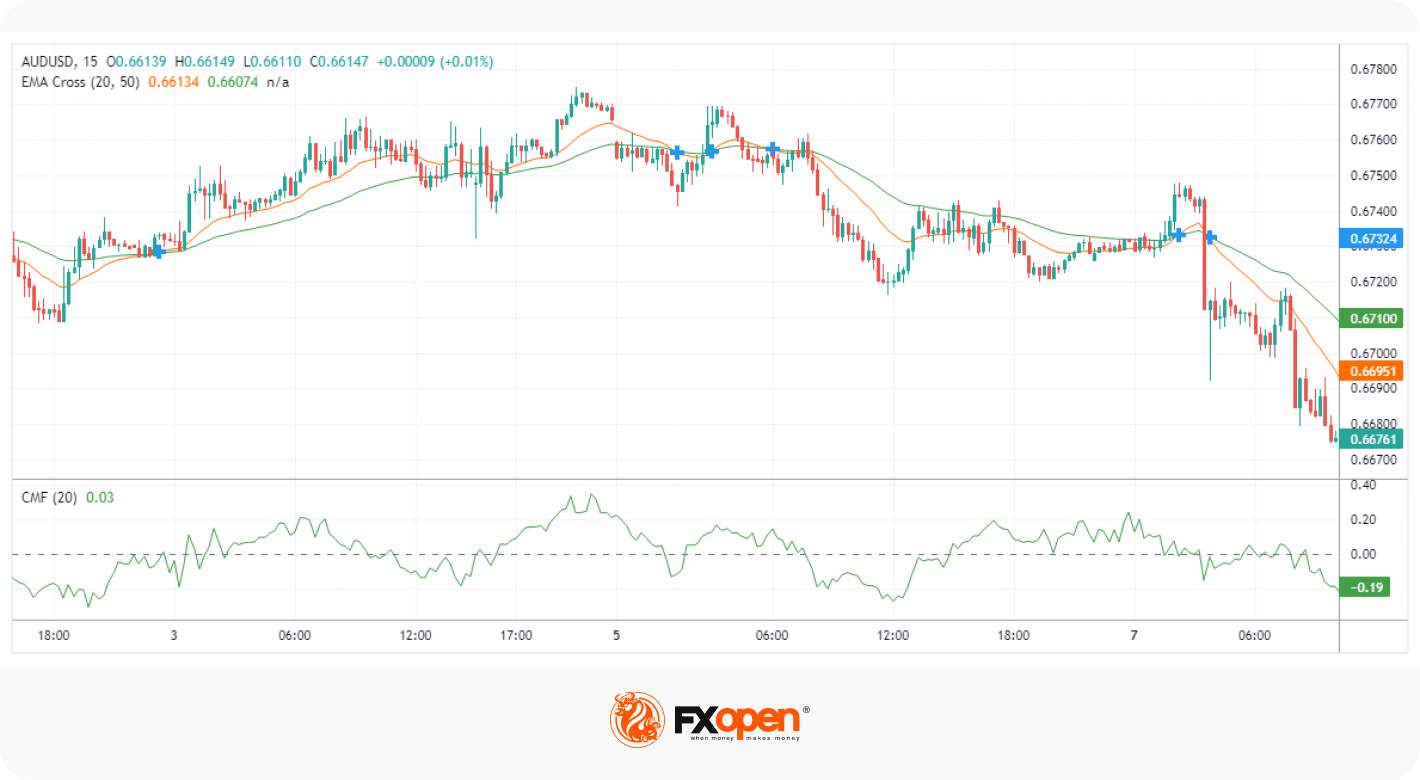
You’ll first need to decide on your asset and timeframe. We’ll use AUD/USD on the 15-minute timeframe, but you can use any asset and timeframe as the indicator’s effectiveness doesn’t depend on them. You can open the TickTrader terminal to get started.
We’ll use the Chaikin Money Flow and Exponential Moving Average (EMA) Cross indicators. You can use two separate moving averages, but the EMA Cross indicator will show you when one crosses over the other.
We will use the CMF indicator with a period of 20 and moving averages with a period of 20 (orange) and 50 (green). Finally, we’ll be conservative with our signal filtering and set two lines on the CMF at +0.10 and -0.10.
Step 2: Look for Entries
With our chart setup, we can start to specify our entry criteria.
Bullish:
- Criteria 1: The fast (20-period) EMA must cross above the slow (50-period) EMA. This is our qualifying signal.
- Criteria 2: Following the qualifying signal, the CMF must close above +0.10.
Bearish:
- Criteria 1: The fast (20-period) EMA must cross below the slow (50-period) EMA. This is our qualifying signal.
- Criteria 2: Following the qualifying signal, the CMF must close below -0.10.
Note: even if the CMF cross occurs 10 candles later, we can still enter, given that a) our direction has been confirmed by the EMA crossover and b) a move beyond +0.10 or -0.10 indicates that momentum is picking up.
Step 3: Setting a Stop Loss Level
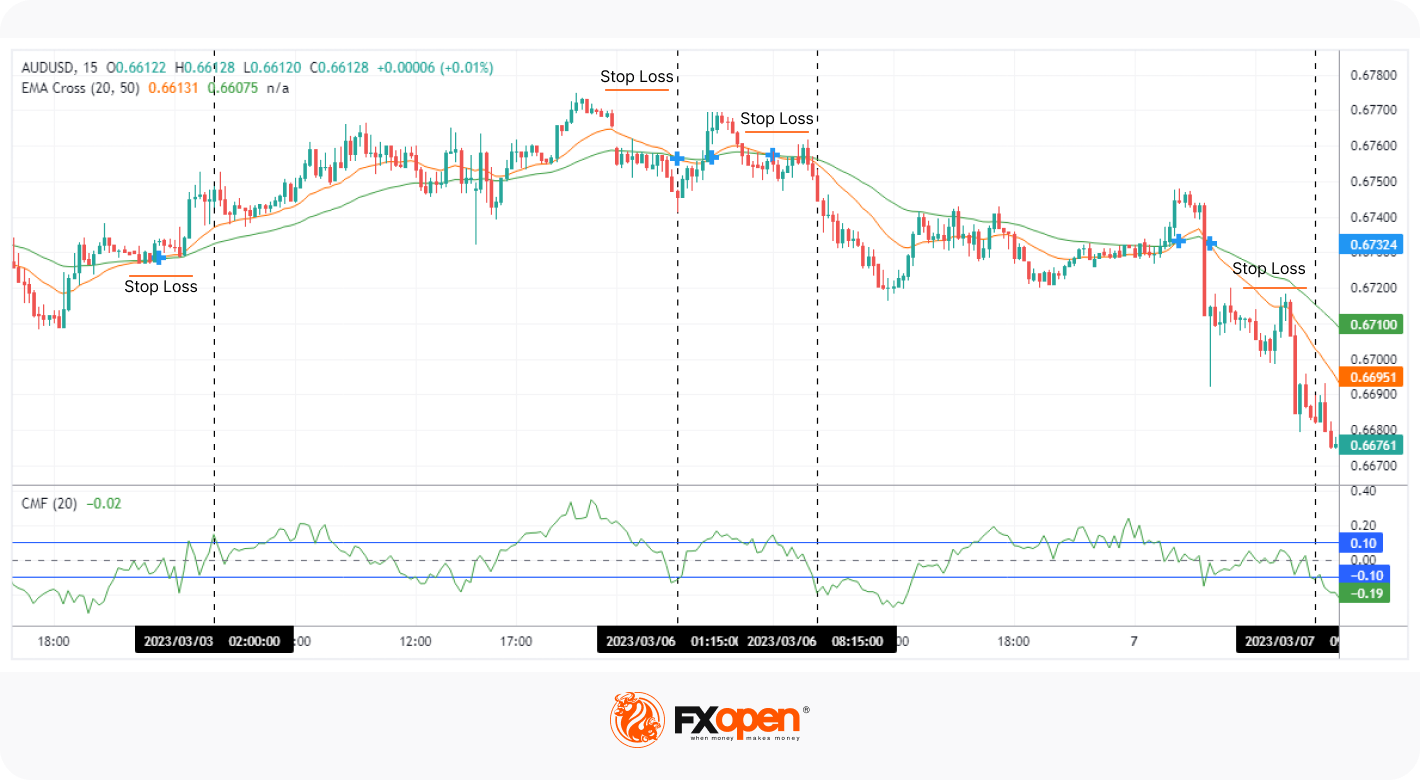
Unlike other indicators, the CMF gives no clear area where we can set stop losses. As such, it’s best to just use a nearby swing point. If there aren’t any clear points nearby and you’re forced to use an excessively wide stop, then you could forgo taking the trade if it means your risk/reward ratio is poor.
Step 4: Taking Profits
Likewise, it doesn’t show where profits can be taken. You could set a minimum risk/reward ratio, like 1:2 or 1:3, then look for areas of support or resistance beyond that minimum to start taking profits.
Conversely, since this is a momentum/trend-based strategy, you could do away with setting a take-profit target and trail your stop loss above or below key swing points as the trend progresses. This approach may help you to squeeze a little bit more profit out of your position compared to setting a hard target.
What to Do Next
Hopefully, this article has helped to answer any questions surrounding “what is the CMF indicator, and how do I trade it?” Wondering what to do next? You can try this:
- Practice using the strategy above to get a feel for how the CMF indicator works.
- Try combining it with other indicators, like Relative Strength Index (RSI) or Donchian Channels.
- Read up on related Chaikin indicators, like Chaikin Volatility and Chaikin Oscillator.
- When you feel ready, you can open an FXOpen account and put your knowledge to the test!
*At FXOpen UK and FXOpen AU, Cryptocurrency CFDs are only available for trading by those clients categorised as Professional clients under FCA Rules and Professional clients under ASIC Rules, respectively. They are not available for trading by Retail clients.
This article represents the opinion of the Companies operating under the FXOpen brand only. It is not to be construed as an offer, solicitation, or recommendation with respect to products and services provided by the Companies operating under the FXOpen brand, nor is it to be considered financial advice.
Stay ahead of the market!
Subscribe now to our mailing list and receive the latest market news and insights delivered directly to your inbox.


Latest articles

Nasdaq 100: 48 Hours of Chaos, One Trendline Standing in the Way
Wall Street just lived through one of its wildest 48 hours of the year. On Wednesday, the Fed held rates steady at 3.50%-3.75%, but three FOMC members broke ranks to demand a hike—an unusually hawkish dissent

Amazon Analysis: Strong Earnings Coincide with a Breakout from the Correction
On 30 July, Amazon.com reported its financial results for the second quarter of 2026, significantly exceeding market expectations. Revenue rose 20% year-on-year to $200.6 billion, compared with the consensus forecast of around $196.5 billion. The main growth

GBP/USD and EUR/GBP Await Key Bank of England Decision
The pound strengthened following the outcome of the US Federal Reserve meeting, where the central bank, as expected, kept interest rates unchanged. However, the Fed did not provide the market with clear signals of an imminent shift towards rate cuts,