


Donchian Channel Indicator
FXOpen
The Donchian Channel indicator is a powerful tool that’s been employed by traders around the globe for decades. What does it stand for, and how do traders use it? In this guide, we’ll break down the components of Donchian Channels, how to interpret them, and offer a sample strategy that you can get started with right away.
What Is the Donchian Channel Indicator?
The Donchian Channel indicator, also known as the DC indicator, is a technical analysis tool developed in the 1960s by Richard Donchian, a pioneer of modern trend-following strategies. It’s used to identify the current markettrend and to determine potential buy and sell signals.
The Donchian Channel is a close relative of the Bollinger Bands and Keltner Channel volatility-based indicators. Like these two indicators, it features three lines: an upper boundary, a lower boundary, and a midpoint line. However, unlike Bollinger Bands and Keltner Channels, which are based on standard deviations and average true range (ATR), respectively, the Channels are based only on the highest and lowest prices over a specified period.
Donchian Channels are a versatile tool that can help traders gauge the strength of breakouts and identify potential reversal points, but their best use is in spotting emerging trends. While the indicator shouldn’t be used in isolation, it can be an effective addition to a trader’s arsenal when used alongside other tools, like oscillators and volume indicators.
Donchian Channels Formula and Settings
Donchian Channels are plotted using the high and low prices of an asset over N periods. The formula for Donchian Channels is relatively easy to understand. It follows:
- Upper Boundary: The highest high over N periods
- Lower Boundary: The lowest low over N periods
- Middle Line: (Upper Boundary price + Lower Boundary price)/2
Here, N can be adjusted to suit the trader’s preferred Donchian Channel settings. By default, N is usually set to 20 periods. A lower number will increase the responsiveness of the Channels but may also produce more false signals and create more noise, which can cause confusion. In contrast, a higher number will supply fewer signals overall but can boost the accuracy of the ones it does provide. For the sake of simplicity, we’ll use 20 periods throughout the rest of this article.
How to Interpret Donchian Channels
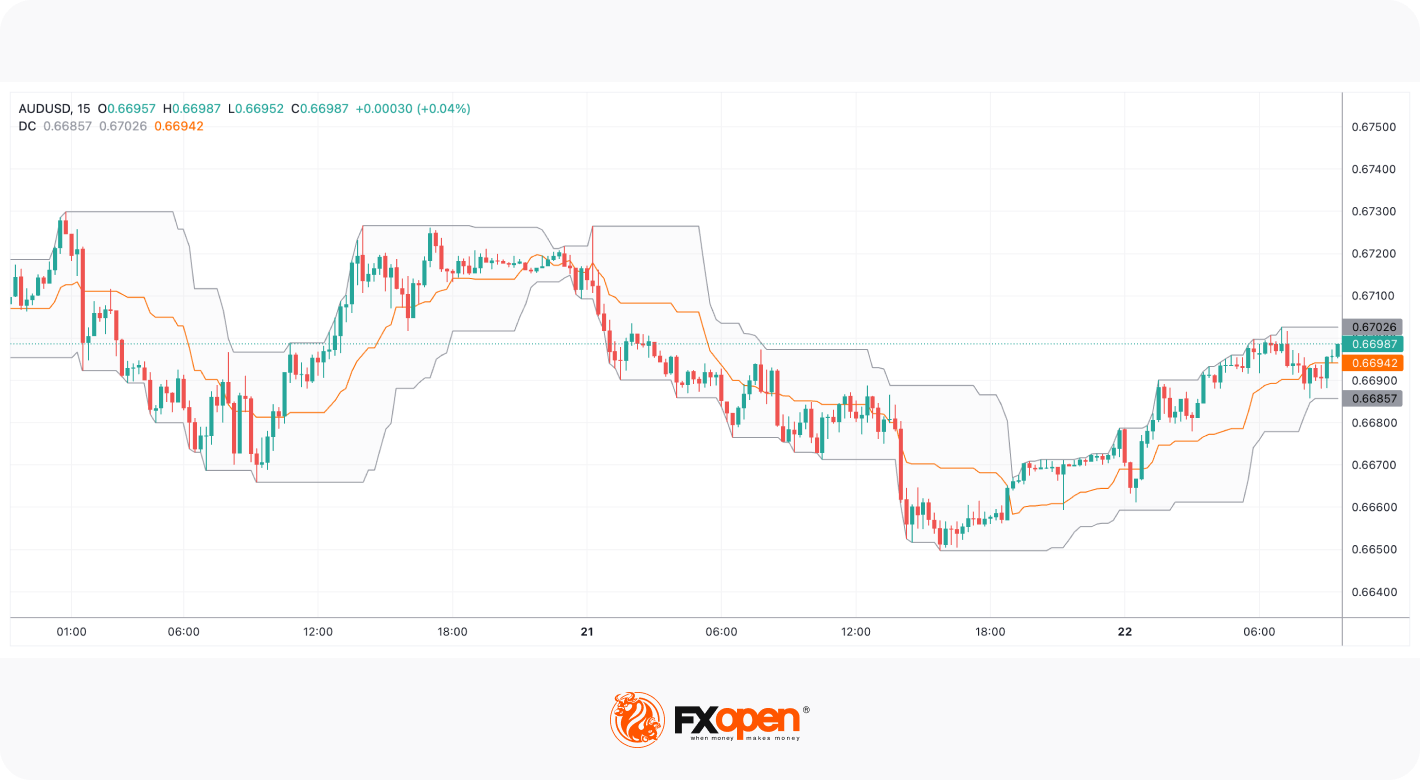
Like the previously mentioned Bollinger Bands and Keltner Channels indicators, Donchian Channels are a measure of volatility. When volatility is high, the highest highs and lowest lows over the past N periods are likely to be more extreme. This is represented by a widening Donchian Channel. Similarly, when volatility is low during consolidation phases, the Channel will become narrower.
Trends
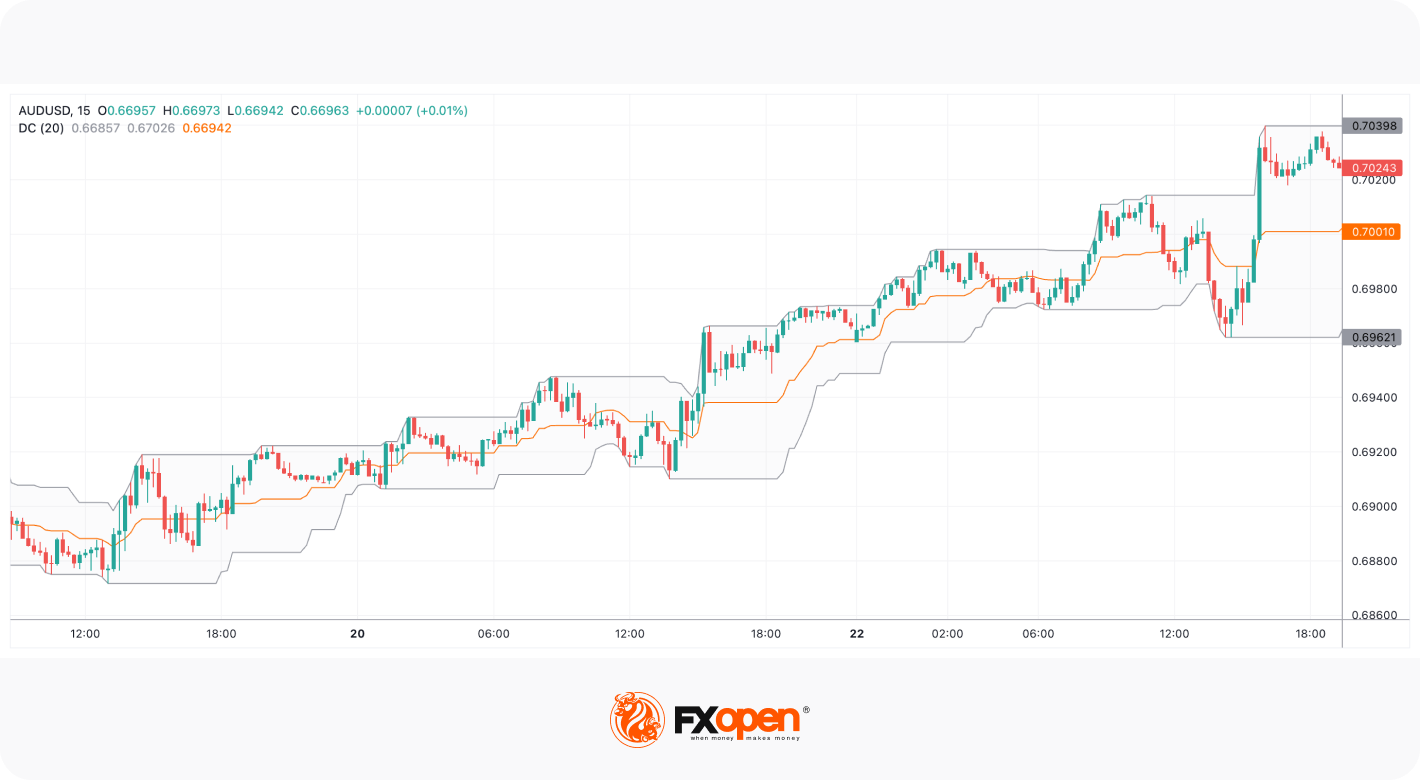
To determine a trend using Donchian Channels, traders will look at the slope of the upper and lower bounds. When the upper bound is consistently moving higher while the lower bound stays flat, it’s a signal that bullish momentum is entering the market. A lower bound that moves down while the upper bound stays flat is indicative of bearish momentum.
This is because, when a trend is strong, prices will continually make higher highs or lower lows, exceeding that of the last 20 periods. For example, when an asset is bullish and moves to its highest high over the past 20 periods without a lower low, we’ll see the upper bound trend upward while the lower bound temporarily remains flat. This lower bound will also move higher eventually, confirming the bullish trend.
Breakouts
Donchian Channels can be used to trade breakouts. There are two primary signals breakout traders look for: breaks above or below the midpoint line and touches to the upper/lower boundaries. Since the midpoint is effectively a moving average, a price can be considered bullish when it closes above the line and vice versa, offering a signal for breakout traders to potentially enter a trade.
The more effective way to trade breakouts with the Channels is to look for multiple confirmatory touches. Why look for multiple touches? Because it’s not uncommon for prices to make a higher high or lower low before reversing. At least with multiple touches, it confirms that momentum is building in a certain direction.
Reversals
Trading reversals with Donchian Channels is more complex than identifying trends or breakouts, but it is possible. In a ranging market, the upper and lower boundaries can be considered areas of resistance and support, respectively. In this scenario, they’re both likely to be plotted as fairly flat lines, given the absence of a trend in the market.
Therefore, if the price touches the upper boundary, traders can either close long positions or open short ones. If the price is at the lower boundary, traders usually close short positions or open long ones.
Without using the indicator, many traders would already identify the highs and lows of a trading range as potential support/resistance levels. Donchian Channels can help plot these areas visually with little effort and also show traders smaller areas of support or resistance they may have missed.
Using Donchian Channels in a Strategy
Now that we’ve discussed the mechanics behind the Channels and how to interpret them, let’s take a look at how to use the Donchian Channel indicator in a strategy.
If you want to follow along and see how this Donchian trend system works, consider using the free TickTrader platform from FXOpen. There, you’ll find dozens of tools and indicators ready to help you find your edge in the markets.
Step 1: Setup Your Chart
To start, identify the asset you want to trade. This strategy can be applied to almost any asset class you might want to trade, including forex, stocks, and commodities. If you don’t already have a brokerage account, open an FXOpen account to gain access to dozens of tradable instruments in minutes.
Then, you’ll need to choose a timeframe, which can be whichever one you prefer. Finally, add the Donchian Channel indicator to your chart and customise its periods, if desired.
Step 2: Wait for Repeated Touches to the Bands
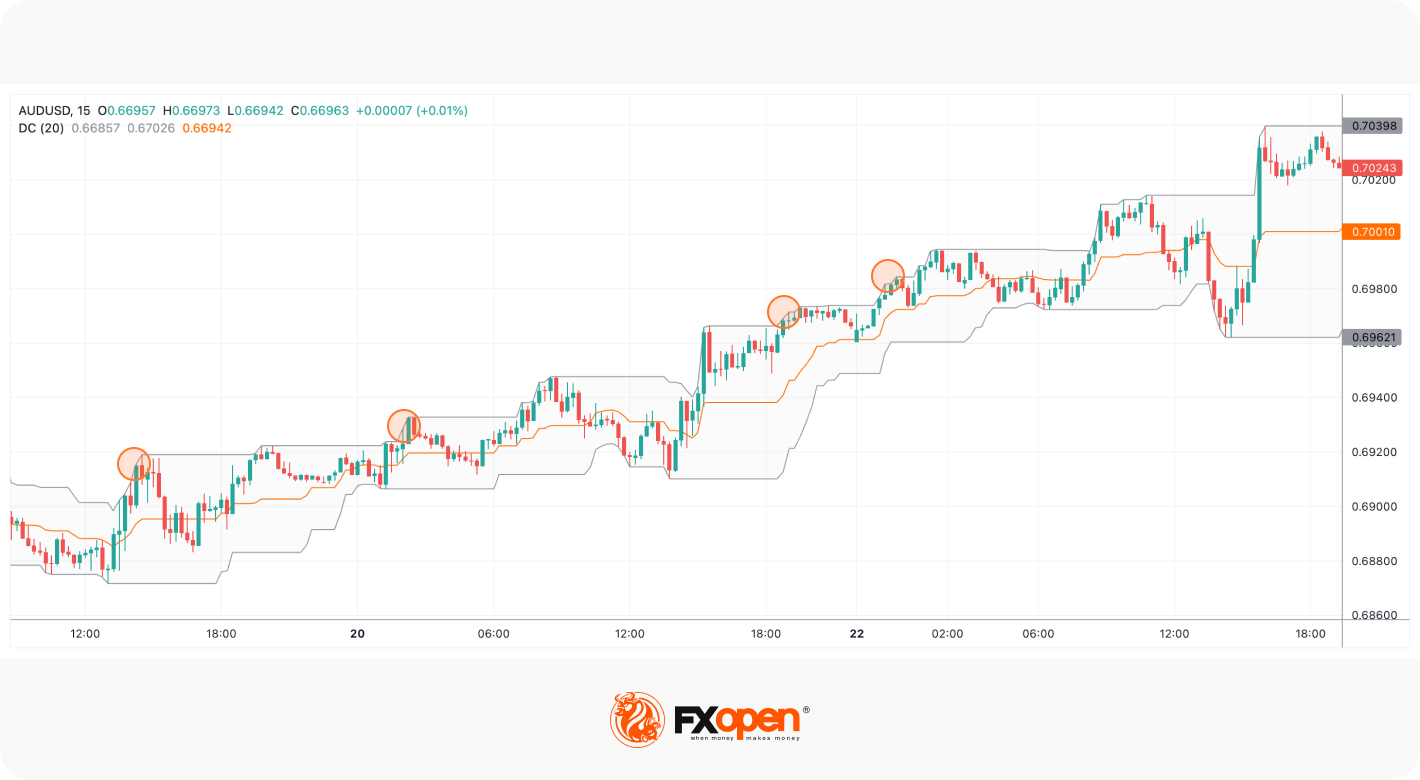
Now, we wait for the price to trend consistently and make repeated touches to the upper or lower boundary. “Repeated” here is open to interpretation. You could look for two or three consecutive touches or wait for three out of four candles to touch the bound. We’ll use three consecutive touches in this example.
Note that these touches should be in the direction of the larger overall trend. If, for instance, you see the price making a brief move downward in a significant bull trend, then simply look for the price to hug the upper band.
Step 3: Enter on the Pullback to the Midpoint
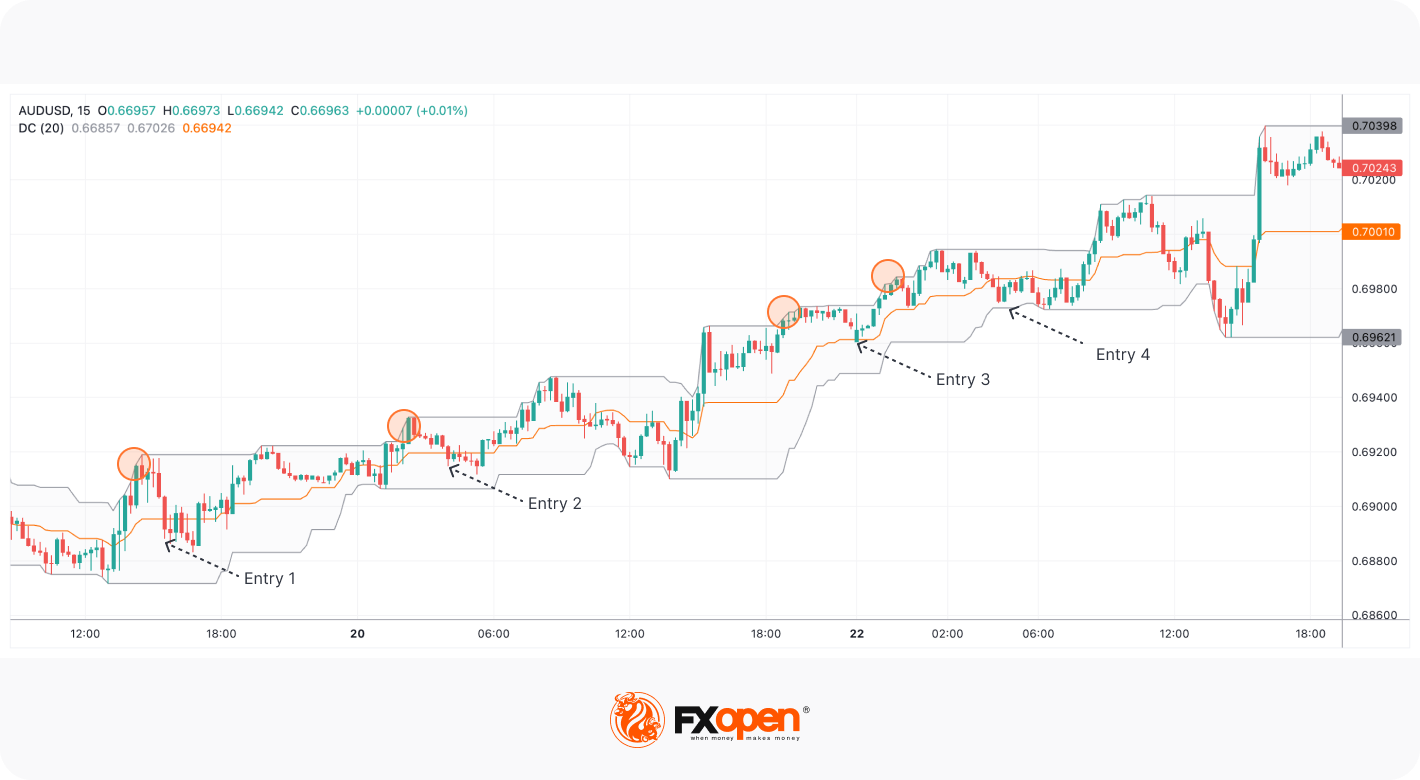
Once we have a signal, we’ll wait for the price to rise above the midpoint before making our entry. In practice, you’ll need to keep an eye on the charts to watch the middle line as it progresses. You can then choose to set a limit order at the line or enter with a market order once the price retraces.
Step 4: Set Your Stop Loss
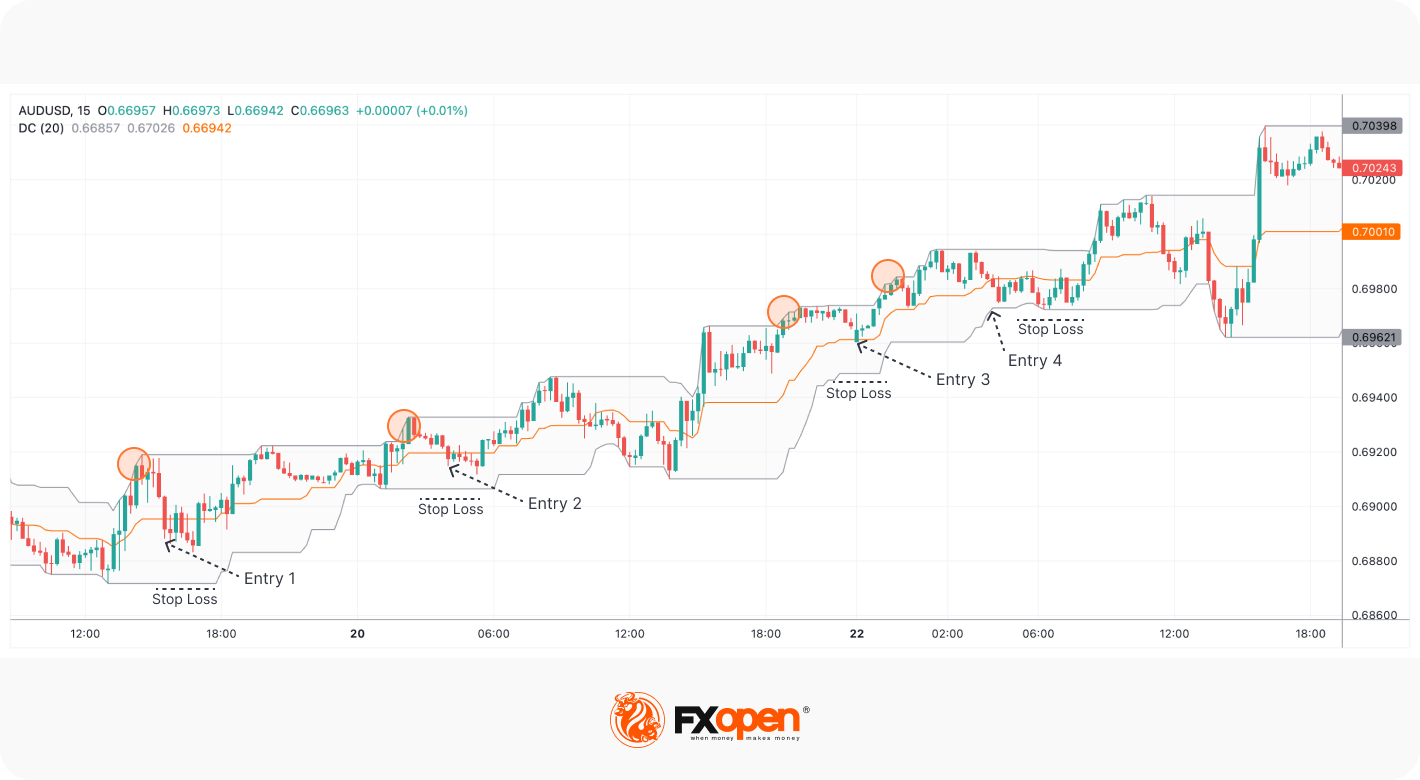
Now that we’re in a trade, we just need to set a stop loss. Thankfully, Donchian Channels make this an easy task. Just set your stop above the upper band if the trend is bearish or beneath the lower if the trend is bullish.
Step 5: Trail Your Stop
Given that this is a trend-following strategy, we want to stay in for as long as possible until the trend is exhausted. Your best bet is to move your stop above or below the relevant band once the trend has progressed, either following it closely or using recent significant flat areas.
Where to Go Next
That’s it! You now have a comprehensive overview of Donchian Channels, including how to interpret them and how to apply them to a strategy. Wondering what to do next? You can try one of these:
- Read up on related concepts, like Bollinger Bands and Keltner Channels.
- Explore their effectiveness when combined with other indicators, like the Relative Strength Index (RSI) or Stochastic.
- Backtest a strategy using historical price data and analyse potential entries and exits, logging your results.
- Open an account to try putting the strategy above into practice.
This article represents the opinion of the Companies operating under the FXOpen brand only. It is not to be construed as an offer, solicitation, or recommendation with respect to products and services provided by the Companies operating under the FXOpen brand, nor is it to be considered financial advice.
Stay ahead of the market!
Subscribe now to our mailing list and receive the latest market news and insights delivered directly to your inbox.


Latest articles

NZD/USD Analysis: A Tug-of-War at the Critical Level
The kiwi has strengthened meaningfully against most peers this month. However, against the US dollar specifically, NZD/USD remains well below its 2026 highs, trading in the mid-0.58 area versus January's peak near 0.6075.
New Zealand's Q2 inflation

AUD/USD and USD/CAD React to Rising Geopolitical Risks
Commodity-linked currencies remain under pressure as geopolitical tensions in the Middle East continue to escalate. The United States has maintained strikes on targets in Iran, while the Tehran-backed Houthis have intensified threats to shipping in the Red Sea and near

GBP/CHF: Trendline or RSI — Which One Is Lying?
Sterling enters this week on firmer footing, with political uncertainty fading fast after Andy Burnham's confirmation as Labour leader eased investor concerns over the succession to Keir Starmer. Markets reacted further to reports pointing to Shabana Mahmood as the frontrunner