


FXOpen
The financial markets are an intricate web of interconnected assets, each influencing and being influenced by numerous others. One of the ways traders decipher these interactions is through the correlation coefficient indicator. In this FXOpen article, we delve into the depths of the correlation coefficient, explaining its calculation, interpretation, use in trading, and limitations.
Understanding the Correlation Coefficient Indicator
Is the coefficient an indicator of correlation? Simply put, yes. The correlation coefficient is an indicator of the degree to which two financial instruments move in relation to each other. It is a statistical tool that traders and investors use to evaluate the strength of the relationship between different asset prices. It can be used to find correlated stocks, forex pairs, commodities, and more, or to compare different asset classes.
The importance of this measure in trading cannot be understated. It provides crucial insights into how various assets behave compared to one another and serves as a valuable tool for assessing market trends, managing portfolio risks, and formulating diversified investment strategies. As such, it serves as a valuable measure for traders to analyse asset behaviour and market trends. By understanding the connection between different assets, traders can make more informed decisions about buying, selling, and holding positions.
Calculating the Correlation Coefficient
The correlation coefficient is calculated using a mathematical formula that involves several steps and parameters. The formula takes into account the average prices of the two assets and their standard deviation, which is a measure of how much individual prices deviate from the average.
The basic formula for the correlation coefficient (r) is as follows:
r = Σ[(Xi - Xmean)(Yi - Ymean)] / [(n-1)Sx*Sy]
Where:
- Xi and Yi are the individual prices,
- Xmean and Ymean are the averages of those prices,
- Sx and Sy are the standard deviations of prices X and Y,
- n is the number of observations, and
- Σ represents the sum of the calculations for each data point.
In simpler terms, to perform the calculation, traders need to:
- Find the mean of both asset prices.
- Subtract the mean from each individual price to get the deviation.
- Multiply the deviations of both assets for each data point and sum them. This gives you the numerator of the formula.
- Calculate the standard deviations of both assets.
- Multiply the standard deviations together and multiply this result by (n-1) to get the denominator.
- Divide the result from step 3 by the result from step 5.
By following these steps, traders can determine the correlation coefficient between two financial assets, indicating the strength and direction of their relationship. With FXOpen’s native TickTrader platform, you can forget the calculator and get started with the correlation coefficient indicator in minutes.
Interpreting Correlation Coefficient Results
Interpreting the results of the correlation coefficient involves understanding its value and what it signifies about the relationship between two assets. Positive values indicate that the two assets move in the same direction. A value of +1 denotes a perfect positive correlation, where both assets move up or down in perfect unison. However, this value is very rare, so traders consider any figure from 0 to +1 as a positive correlation.
Negative values, on the other hand, indicate an inverse relationship where the assets move in opposite directions. A coefficient of -1 shows a perfect negative correlation, meaning when one asset rises, the other falls by an equivalent amount, and vice versa. The same as with a positive correlation, -1 isn’t a common reading. Therefore, any value from 0 to -1 is considered a negative correlation.
A coefficient of 0 suggests no correlation, indicating the movements of the two assets are independent of each other. There is no predictable relationship between how the two assets move.
In trading, these results can influence decision-making. For instance, a positive value might indicate that a trend in one asset may also be present in another, while a negative figure could suggest an opportunity for diversification to manage risk.
Using the Correlation Coefficient in Trading
In trading, the correlation coefficient has distinct applications that revolve around trend identification and portfolio diversification.
Identifying Trends
In terms of identifying market trends, the indicator provides a statistical basis for assessing the likelihood of two assets moving in tandem.
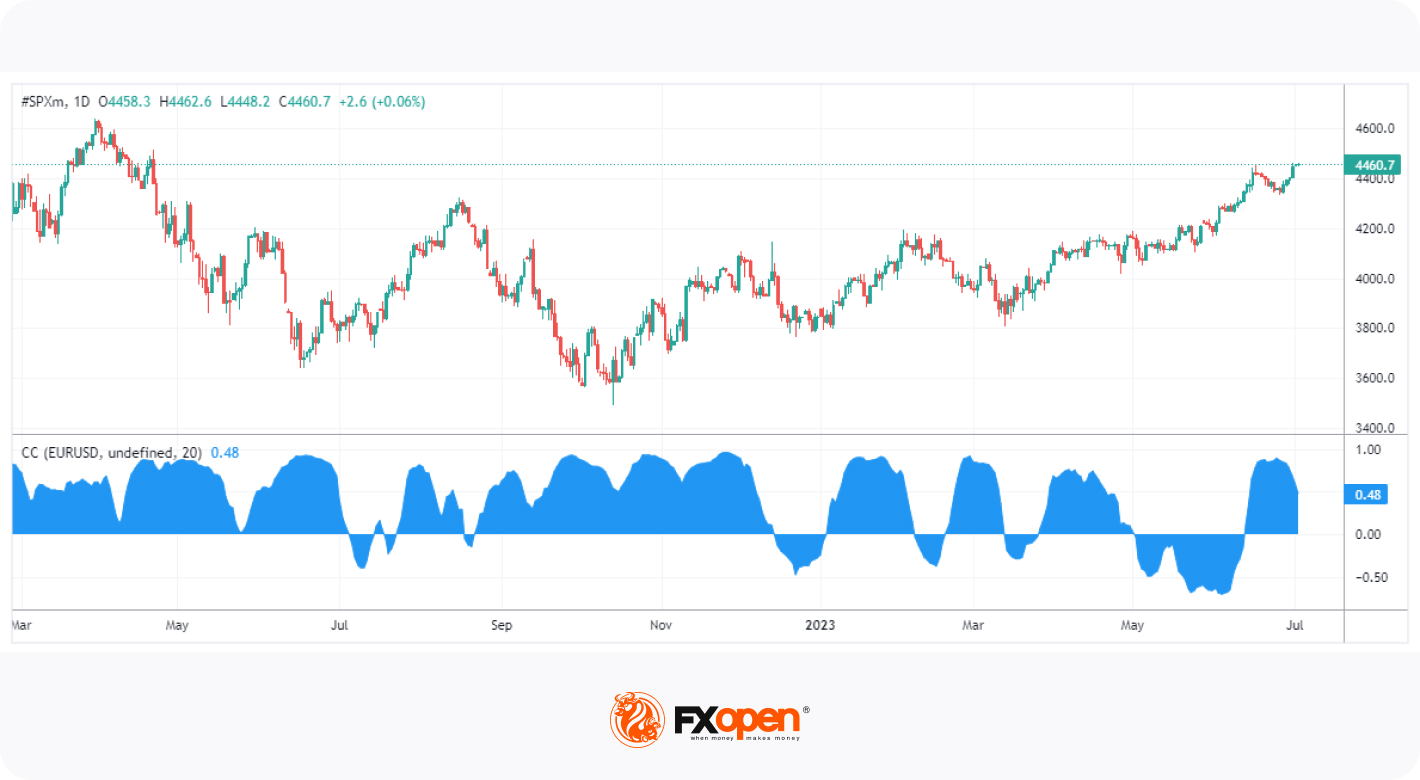
For instance, when there's a high positive correlation (from 0 to +1) between a specific currency pair, say EUR/USD, and a stock index, such as the S&P 500, this could signal a broader market trend where both assets are responding similarly to macroeconomic factors. Traders could choose to use this information by aligning their trading strategy to capitalise on this forex and stock market correlation.
Diversification
For diversification, the correlation coefficient is a critical factor. Traders usually consider a portfolio composed of different asset classes, like stocks and commodities. If the association between these asset classes is negative or close to -1, it means that they usually move in opposite directions.
So, when stock prices fall, the price of commodities might rise, and vice versa. This negative correlation can be harnessed for diversification. By investing in both asset classes, a trader could potentially hedge against losses in one with gains in the other, thereby reducing overall portfolio risk and volatility.
Limitations of the Correlation Coefficient Indicator
While the correlation coefficient is a valuable tool in trading, it's important to understand its limitations to avoid mistakes and ensure effective decision-making.
The first limitation is that the indicator does not factor in third variables. A common misconception is interpreting high correlation (positive or negative) as a cause-and-effect relationship between two variables. However, this relationship only indicates a statistical association, not a causal link. In other words, even if two assets move in sync, it doesn't prove that the movement of one is causing the other to move. For instance, if two assets are positively correlated, it can be only because both react similarly to a third factor, such as shifts in investor sentiment or market conditions.
Secondly, the correlation coefficient is based on historical data, which means it may not accurately predict future correlations or asset price movements. A strong correlation in the past does not guarantee the same relationship in the future.
Examples of the Correlation Coefficient Indicator in Trading
As we round off this article, let’s take a look at some examples of correlations in action.
Correlation Coefficient Analysis in Stock Trading
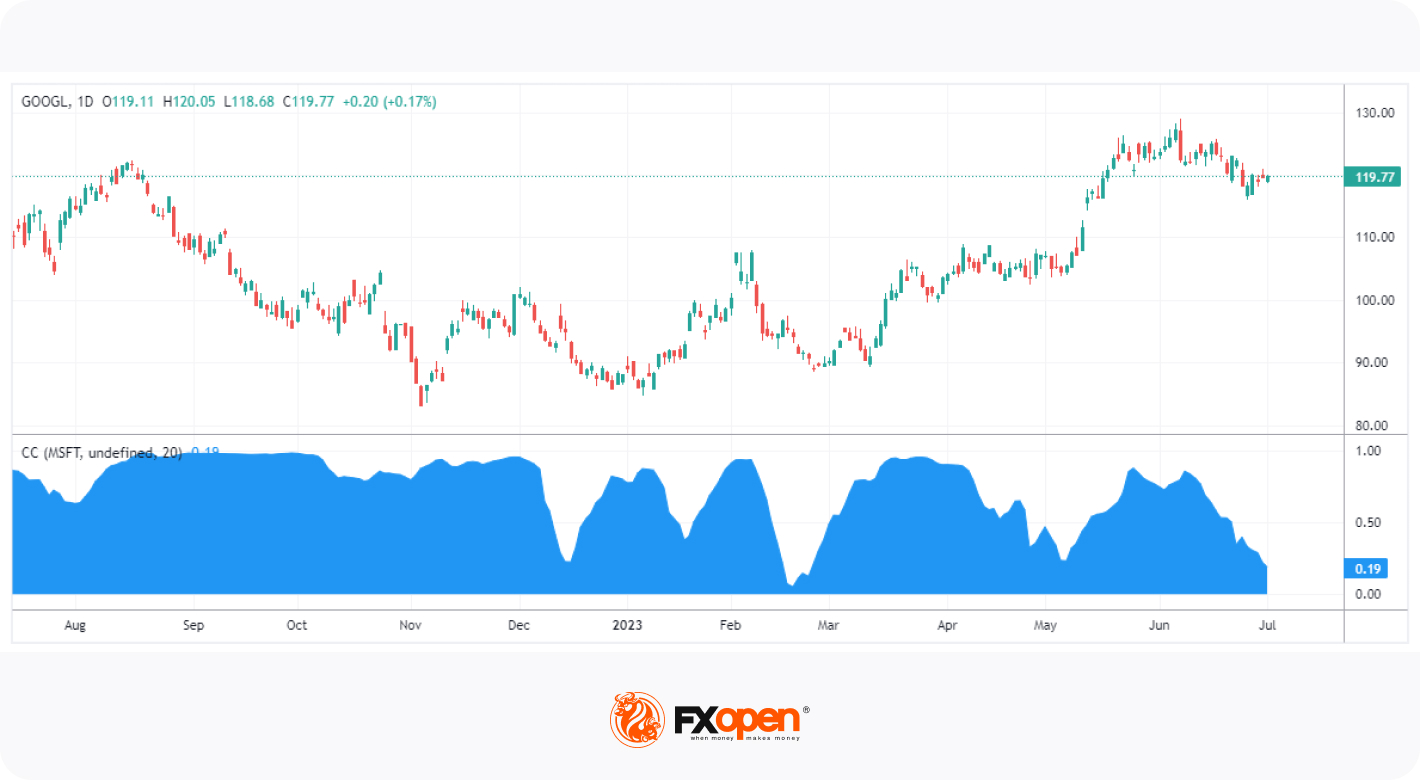
In this correlation coefficient chart, we can see the relationship between two technology companies: Google and Microsoft. Often their stock prices move in tandem due to similar industry factors influencing their performance. While the relationship isn’t perfect, it almost always exhibits some interconnection, including periods of near a 1:1 relationship.
Correlation Coefficient Analysis in Forex Trading
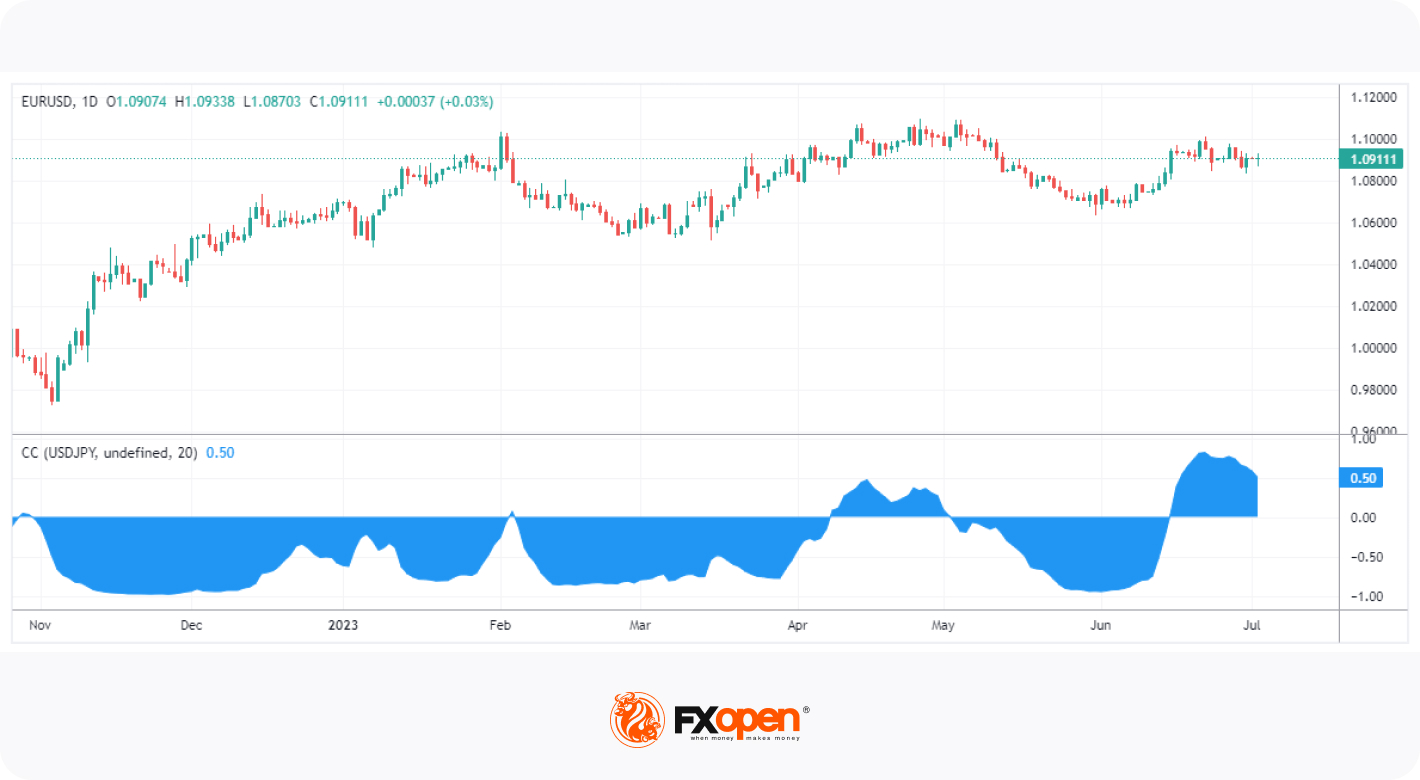
In forex trading, the coefficient can be particularly useful. Here, we see the largely inverse relationship between the EUR/USD and USD/JPY pairs. While it’s to be expected, given the USD's opposite role in both pairs, it provides an opportunity for forex traders.
When the EUR/USD pair rises, the USD/JPY often falls, and vice versa. So if a trader goes long on EUR/USD, then they may want to think twice about also buying the USD/JPY pair, depending on the current coefficient value.
Correlation Coefficient Analysis in Cryptocurrency* Trading
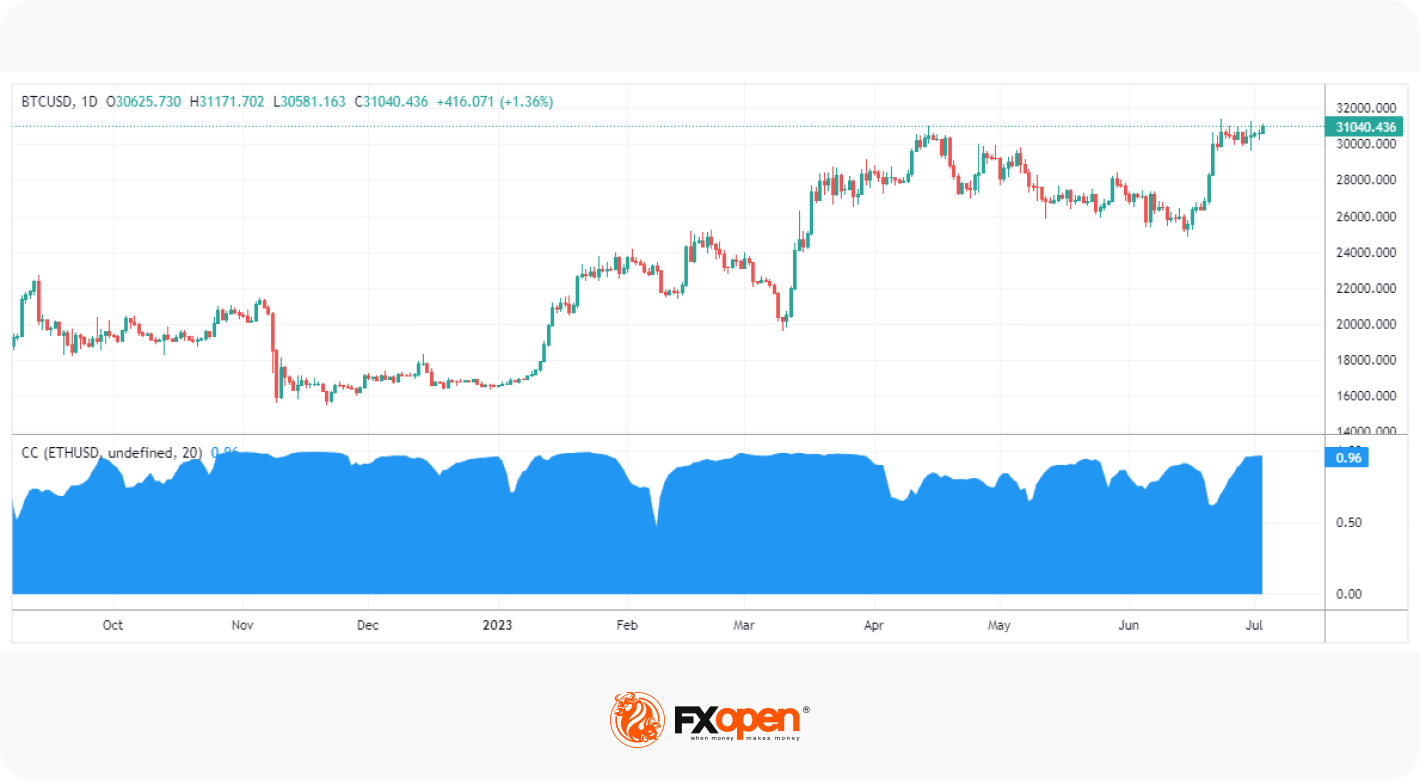
Finally, we have the highly correlated crypto* market. Many cryptocurrencies, especially those with larger market capitalisations, move in tandem with Bitcoin. Here, we can see Bitcoin's relationship with Ethereum, the two largest cryptocurrencies on the market. This correlation is driven by shared market sentiment and similar investor demographics, meaning that when Bitcoin's price rises or falls, Ethereum's price often follows a similar trajectory.
The Bottom Line
In conclusion, the correlation coefficient is a fundamental tool in a trader's arsenal, offering valuable insights into asset relationships and market trends. While it has its limitations, understanding its use and implications can be instrumental in shaping effective trading strategies.
Want to put your newfound knowledge to the test? You can open an FXOpen account to gain access to over 600 markets, analyse their relationships, and hone your correlation coefficient strategy. Happy trading!
*At FXOpen UK and FXOpen AU, Cryptocurrency CFDs are only available for trading by those clients categorised as Professional clients under FCA Rules and Professional clients under ASIC Rules, respectively. They are not available for trading by Retail clients.
This article represents the opinion of the Companies operating under the FXOpen brand only. It is not to be construed as an offer, solicitation, or recommendation with respect to products and services provided by the Companies operating under the FXOpen brand, nor is it to be considered financial advice.
Stay ahead of the market!
Subscribe now to our mailing list and receive the latest market news and insights delivered directly to your inbox.


Latest articles

Market Insights with Gary Thomson: Where Are Oil, Gas & Global Indices Heading?
In this video, we’ll explore the key economic events and market trends, shaping the financial landscape. Get ready for insights into financial markets to help you navigate the week ahead. Let’s dive in!
In this episode of Market

Netflix (NFLX) Shares Pull Back After a 30% Surge
On 21 January, while analysing the NFLX chart, we:
→ identified a descending channel and a resistance zone around the $100 level;
→ noted that Netflix shares were showing a sustained downtrend. Selling pressure had been triggered primarily by reports of a

US Dollar Index (DXY) Rises Above the 100 Level
Today the US Dollar Index (DXY) climbed above the psychological 100 mark for the first time in 2026, supported by a tense fundamental backdrop, with the military conflict in the Middle East acting as the main driver.
→ Financial market participants