


FXOpen
The crypto market has been in a hibernation mode for the past few weeks. Bitcoin is trading with no clear direction around the $600 round figure. Smaller altcoins haven’t budged as well. Compared to their prices two weeks ago, both PPC and NMC are barely changed.
Namecoin Still in Tight Range
Alternative cryptocurrency Namecoin is still in a tight range noted in our latest NMC article. We are currently quoted exactly at 30 cents, only 0.5 cents higher compared to 14 days ago. This is a move of 1.66 percent, a negligible amount for that time frame.
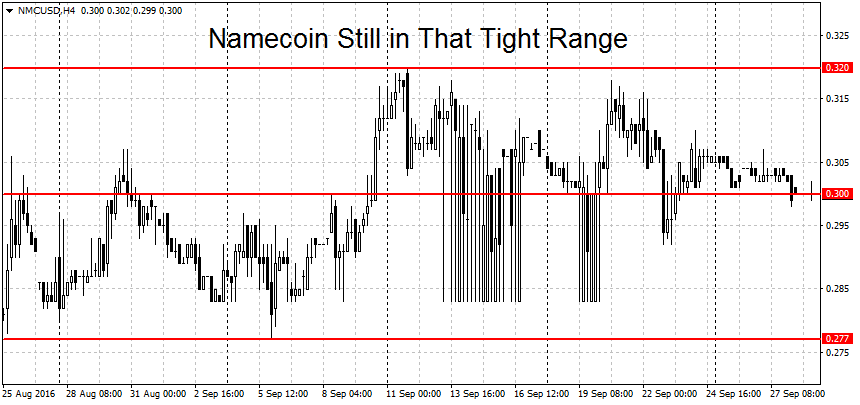
The low volatility environment means that the major levels have remained the same. On the top side, the bulls will have to break $0.32 per coin in order to jump-start a new rally. Higher up we find a resistance at the $0.346 swing high followed by $0.371 and the 40 cents round figure.
On the downside, we’re looking for a break of the $0.27 level. A decisive move below here could usher in a new downtrend. We have more support below here at the $0.25, $0.20 and $0.15 round figures. The longer-run trends for NMC/USD are bearish, both on medium- and long-term charts.
Peercoin Joins Range-Bound Game
Peercoin has considerably calmed down after losing 15 percent two weeks ago. During the latest 14-day time-window, PPC/USD barely moved with a high at $0.349 and a low at $0.29. The total change close-to-close was even smaller at only 0.4 cents or 1.3 percent.
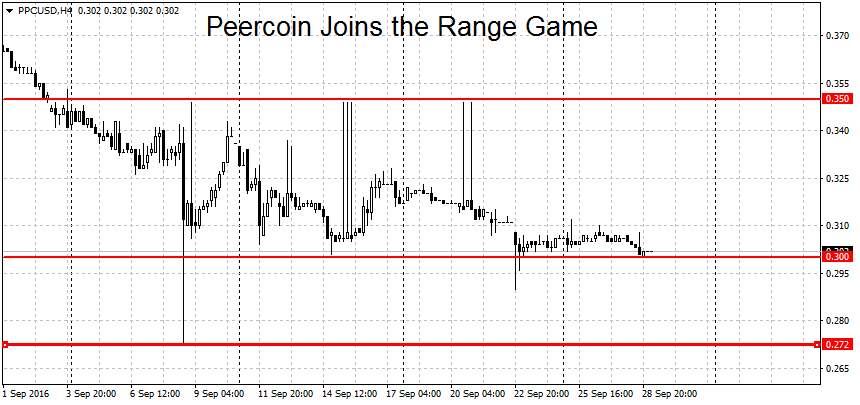
The technical picture has barely changed. We’re still in a ‘wait-and-see’ mode here. A clean break above the 35 cents round figure may start a new PPC rally. Above here we find a strong resistance area around 39-40 cents. A breakout above it could lead to more gains. Higher up we have more resistance at the $0.438 swing high and the 50 cents round figure, closely followed by two more levels at $0.524 and $0.57.
On the lower end, the number to watch is the September low at $0.272. A break below here could start a new downtrend. Further down we find a support at the $0.237 spike low followed by the multi-year low at $0.211 per coin. The picture looks undecided on the higher time-frame charts as well. The medium-term (weekly) trend is bearish but the long-term (monthly) trend is still in a neutral mode.
FXOpen offers the world's most popular cryptocurrency CFDs*, including Bitcoin and Ethereum. Floating spreads, 1:2 leverage — at your service. Open your trading account now or learn more about crypto CFD trading with FXOpen.
*At FXOpen UK and FXOpen AU, Cryptocurrency CFDs are only available for trading by those clients categorised as Professional clients under FCA Rules and Professional clients under AFSL 412871 – ABN 61 143 678 719 respectively. They are not available for trading by Retail clients.
This article represents the opinion of the Companies operating under the FXOpen brand only. It is not to be construed as an offer, solicitation, or recommendation with respect to products and services provided by the Companies operating under the FXOpen brand, nor is it to be considered financial advice.
Stay ahead of the market!
Subscribe now to our mailing list and receive the latest market news and insights delivered directly to your inbox.

Latest articles

Coca-Cola (KO) Share Price Drops Sharply After Earnings Report
On 23 October, Coca-Cola (KO) released its third-quarter earnings, which exceeded forecasts:
→ Earnings per share (EPS): Actual = $0.77; Expected = $0.74
→ Gross revenue: Actual = $11.95 billion; Expected = $11.69 billion
Despite these positive results, KO's share price saw

ETH/BTC Hits 44-Month Low
The ETH/BTC exchange rate has reached its lowest level in 44 months, as shown on the ETH/BTC chart, indicating that in 2024, cryptocurrency investors seem to favour Bitcoin over Ethereum.
The downward trend, shown by the red channel,
What Is a Doji Candle, and How Can You Use It in Trading?
A Doji candle is a technical analysis tool reflecting the uncertainties in the market. Although it provides strong signals, it should be used with other patterns or technical indicators. Why do traders look for Dojis when trading stocks, commodities, and