


Dash Pauses Rally, Ether Range-Bound
FXOpen
Hello, readers. From this week on, we will include two new cryptocurrencies in our weekly updates: Dash and Ethereum. This will be done on a rotation basis. We’ll cover DSH and ETH today, while next week we’ll be back with the usual currencies Namecoin and Peercoin.
Dash Pauses Rally
Dash, formerly known as Darkcoin, is one of the few anonymizing coins that has lately sprung up. It aims to solve what some say Bitcoin’s main problem is: complete transparency and traceability of all transactions. In its current implementation, it adds privacy by combining identical inputs from multiple users into a single transaction with several outputs. Due to the identical inputs, transactions (usually) cannot be directly traced, somewhat obfuscating the flow of funds. More on Dash basics here.
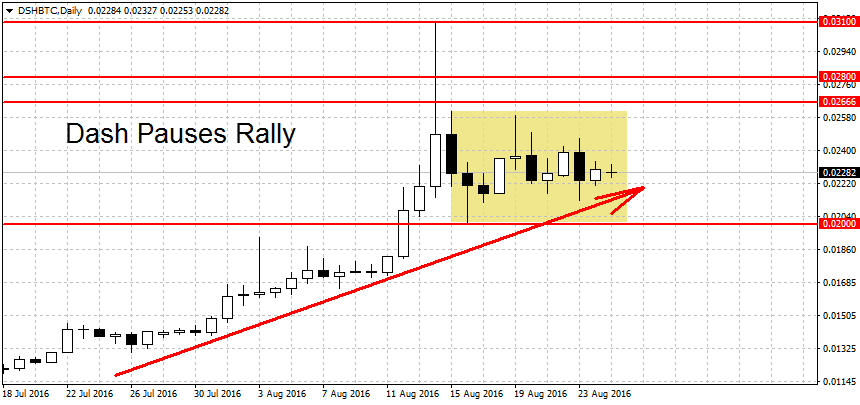
Dash has a market cap of around $88 million and is currently at the 7th position. Let’s take a look at some charts. On the picture above we can see Dash versus Bitcoin (DSH/BTC). Notice how the altcoin is in a ‘holding pattern’ after the rally in the first half of August. After we peaked at 0.031 the prices fell back down to 0.0201 before stabilizing in the current 0.022-0.023 area.
By looking at other charts it appears that the spike high of 0.031 on FXOpen was due to low liquidity. On Poloniex, which currently has the highest daily volume for DSH/BTC, the highest high was 0.0266 in August while the all-time high was 0.028 back in 2014. Due to the proximity of these levels, waiting a break of 0.028 seems prudent. A break above this all-time high would spark a new upward trend for Dash. On the long-term charts (weekly and monthly) the trend is bullish as well.
Ether Trades Range-bound
Ethereum is currently number two cryptocurrency at $930 million, according to CoinMarketCap. It has been trading range-bound this month and most of the summer as well. We are now quoted at 0.0194 ETH for one Bitcoin.
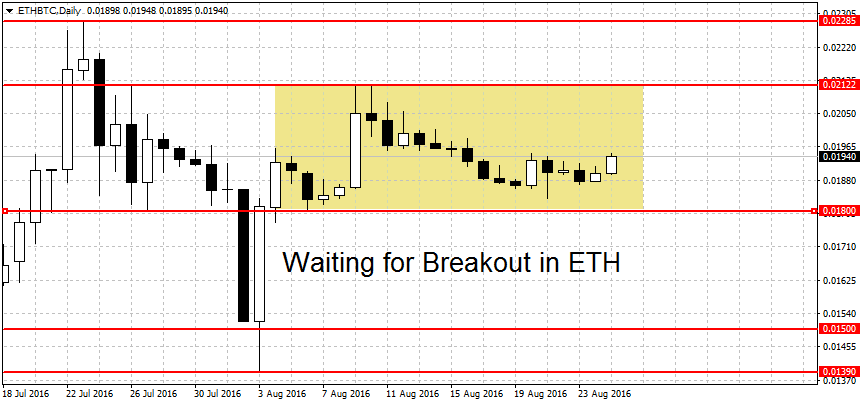
On the chart above we can see how the range keeps getting narrower. This is usually a prelude to a breakout so let’s take a look at some levels. On the upside we’re looking at 0.02122 as a potential short-term trend starter. We have a lot of resistance higher up though, starting at 0.2285 and 0.02610 and continuing with the round figures at 0.028 and 0.03.
On the other end the bears may be looking at 0.018. A breakdown below this level could start a new short-term trend lower. Support levels below here can be found at the$0.015 round figure followed by 0.0139, 0.0123 and another round level at 0.01. A decisive break of this figure could intensify the losses.
FXOpen offers the world's most popular cryptocurrency CFDs*, including Bitcoin and Ethereum. Floating spreads, 1:2 leverage — at your service (additional fees may apply). Open your trading account now or learn more about crypto CFD trading with FXOpen.
*Important: At FXOpen UK, Cryptocurrency trading via CFDs is only available to our Professional clients. They are not available for trading by Retail clients. To find out more information about how this may affect you, please get in touch with our team.
This article represents the opinion of the Companies operating under the FXOpen brand only. It is not to be construed as an offer, solicitation, or recommendation with respect to products and services provided by the Companies operating under the FXOpen brand, nor is it to be considered financial advice.
Stay ahead of the market!
Subscribe now to our mailing list and receive the latest market news and insights delivered directly to your inbox.


Latest articles

Pound at Key Levels: Markets Assess Impact of Political Uncertainty in the UK
The British pound remains under pressure following increased political uncertainty in the United Kingdom triggered by the Prime Minister’s resignation. Investors are assessing potential shifts in the political and economic policy outlook after the head of government stepped down,

Silver: Fed Tightens Its Tone as Price Returns to the Volume Profile Zone
Silver came under pressure following the Federal Reserve’s June meeting, at which policymakers kept interest rates unchanged at 3.50–3.75%. Nine of the 18 committee members still see the possibility of a rate increase this year, reinforcing

Ethereum: Market Assesses the Strength of the Corrective Recovery
Following a period of heightened volatility in early June, investor attention in Ethereum has once again shifted towards institutional demand and the development of the spot ETF market in the United States. The funds launched last year continue to serve