


FXOpen
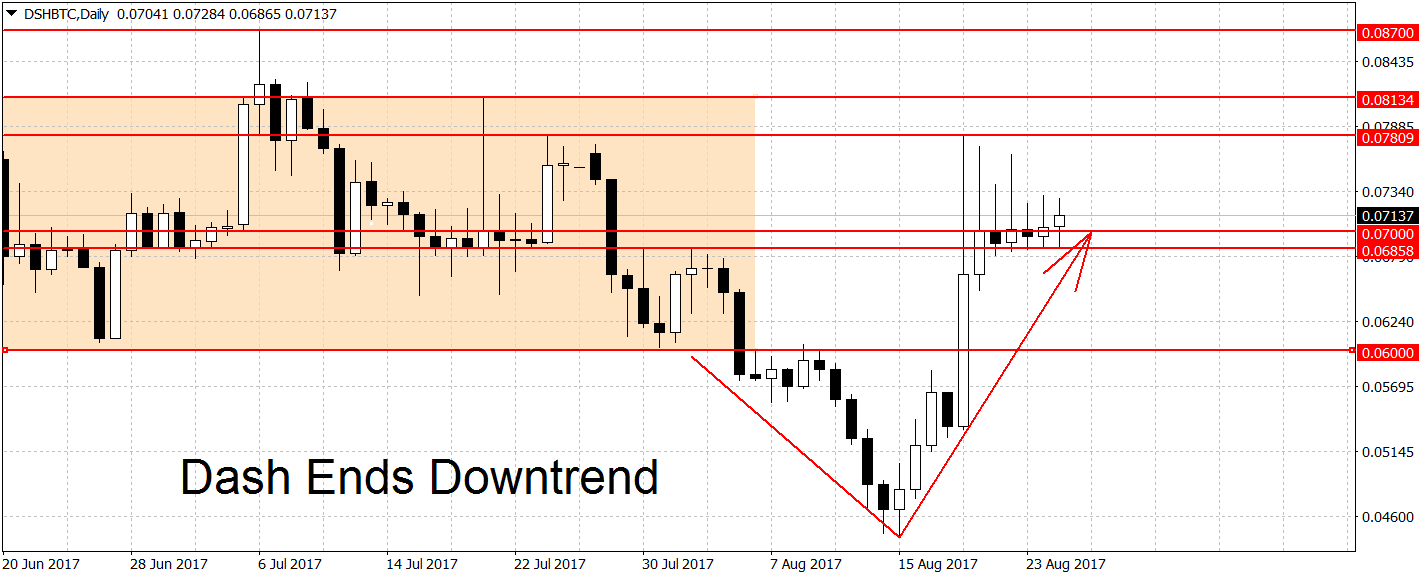
Dash prices spiked higher on August 19th and ended the two-week-long drawdown. Ether, on the other hand, remains locked in a range versus BTC.
Ether Still in Range
While both ETH and BTC continue to clock gains versus the U.S. Dollar, against each other they’re trading flat. Ether is quoted at 0.0745 BTC right now, slightly up compared to prices one week ago.
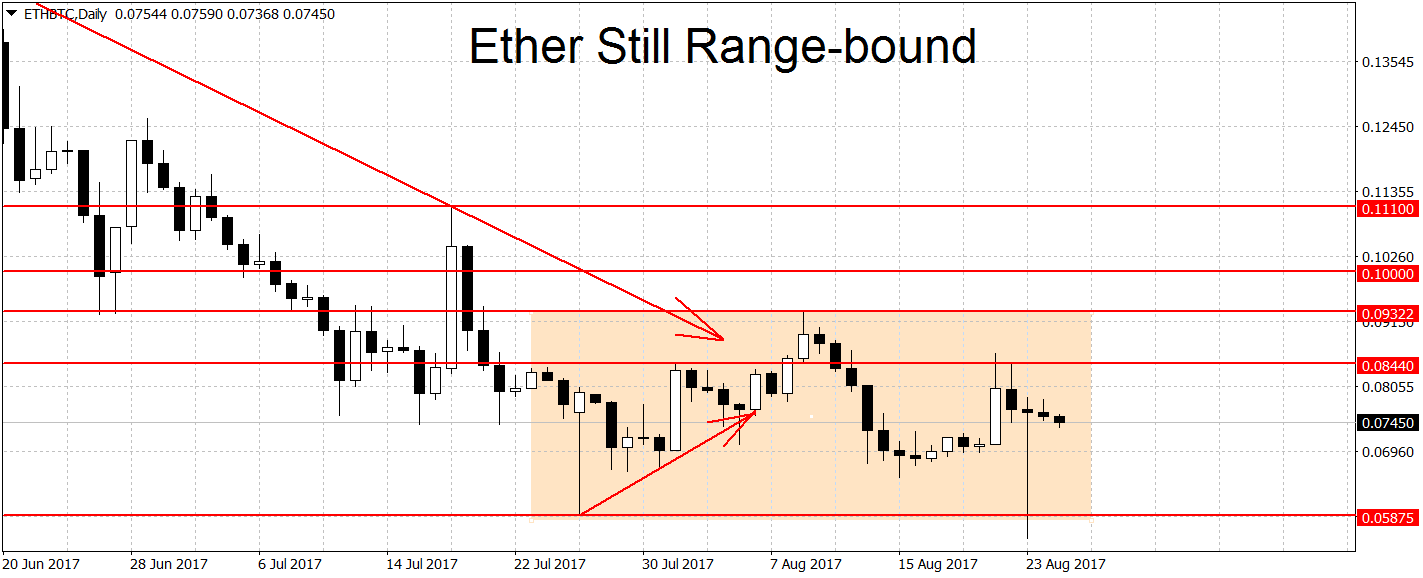
The two important levels haven’t changed much. On FXOpen charts we’re seeing a spike to a low of 0.05495 on August 23rd. But this crash was instantly retraced and could’ve been the result of a bad tick. Thus the key level on the downside remains at 0.05875 BTC. A breakdown below here would start a new downtrend in prices. As usual, we’re looking for a decisive break, not just a brief and shallow spike below/above the levels.
On the upside, the figure to watch remains at 0.09322. A breakout above here could start a new ETH rally. Not far from here we find the first notable resistance at the 0.1 round figure, followed by another important level at 0.111 BTC per coin. A break of this level could lead to more gains higher up. On the long-term charts ETH/BTC is bullish on the monthlies but range-bound on the weeklies.
Dash Breaks to the Upside
The nearly two-week-long downtrend in DSH/BTC ended with a large green candle on August 19th. This candle broke the 0.06858 level, penned in our previous article as a trend-ender. It also began a new upward trend in prices.
The news driver behind the large move seems to be the signing of a partnership with the Arizona State University. Dash is launching a ‘Blockchain Research Lab’ which will be hosted at ASU’s Fulton College of Engineering and will focus on scalability, mining centralization, Blockchain security and energy efficient mining. More on this HERE.
The rally faces resistance at the 0.07802 spike high. This coincides with the previous swing high on July 24th (0.07809 BTC). A breakout above here could extend the move higher to the 0.08 round figure and possibly beyond.
On the lower end, we’re looking at 0.048 BTC level as a potential trend-ender. Support above here can be found at the 0.05 round figure. On both longer-term charts (weekly and monthly) DSH/BTC is trending higher as well.
Trade crypto with FXOpen broker.
FXOpen offers the world's most popular cryptocurrency CFDs*, including Bitcoin and Ethereum. Floating spreads, 1:2 leverage — at your service (additional fees may apply). Open your trading account now or learn more about crypto CFD trading with FXOpen.
*Important: At FXOpen UK, Cryptocurrency trading via CFDs is only available to our Professional clients. They are not available for trading by Retail clients. To find out more information about how this may affect you, please get in touch with our team.
This article represents the opinion of the Companies operating under the FXOpen brand only. It is not to be construed as an offer, solicitation, or recommendation with respect to products and services provided by the Companies operating under the FXOpen brand, nor is it to be considered financial advice.
Stay ahead of the market!
Subscribe now to our mailing list and receive the latest market news and insights delivered directly to your inbox.


Latest articles

Market Insights with Gary Thomson: Where Are Oil, Gas & Global Indices Heading?
In this video, we’ll explore the key economic events and market trends, shaping the financial landscape. Get ready for insights into financial markets to help you navigate the week ahead. Let’s dive in!
In this episode of Market

Netflix (NFLX) Shares Pull Back After a 30% Surge
On 21 January, while analysing the NFLX chart, we:
→ identified a descending channel and a resistance zone around the $100 level;
→ noted that Netflix shares were showing a sustained downtrend. Selling pressure had been triggered primarily by reports of a

US Dollar Index (DXY) Rises Above the 100 Level
Today the US Dollar Index (DXY) climbed above the psychological 100 mark for the first time in 2026, supported by a tense fundamental backdrop, with the military conflict in the Middle East acting as the main driver.
→ Financial market participants