


Ether, Dash Crash 23 Percent
FXOpen
Both Ether and Dash had some large losses during the past seven days. Ether fell to a new yearly low of 0.04205 BTC. Dash also fell to a new 2018 low at 0.02186 BTC. Both coins bounced somewhat from these lows but they remain firmly in a downtrend.
Ether Crashes 24 Percent
Ether crashed by 18 percent since our last update. Measured to the lows the decline was around 24 percent. The clearing of the 0.05 – 0.0524 BTC area acted as a catalyst to further losses. We are quoted at 0.04556 BTC right now, significantly below the 0.05542 BTC price recorded last week.
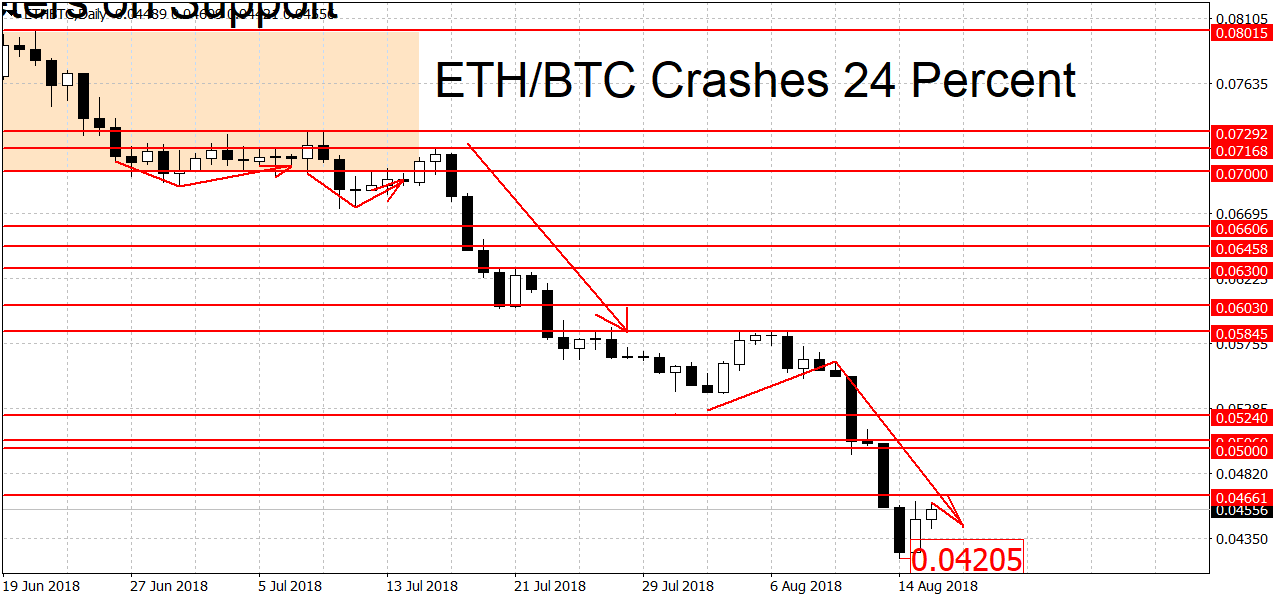
Ether is still in a downtrend versus bitcoin. The number to watch is the swing high at 0.05845 BTC. A decisive breakout above here would both end the downtrend and start a new rally in prices. Below this however we have the former strong support area at 0.05 – 0.0524 BTC. This area should now turn to resistance. Other resistance levels above 0.05845 BTC can be found at 0.063 BTC, 0.06734 BTC, 0.07168 BTC and 0.07292 BTC. A break above 0.07292 BTC may lead to more gains. The 0.06 and 0.07 BTC round figures may also act as weak resistance.
On the lower end there’s not as many visible support levels. This week’s low at 0.04205 BTC may as weak support. This is followed by the 2016 high at 0.0372 BTC, which wasn’t broken until the next year. The 0.03 BTC round figure may act as some support, followed by more support around the 16-month low at 0.0237 BTC per coin. During 2017 ETH/BTC had a large rally in the span of a few weeks, leaving us with no important former lows and highs that could act as potential support/resistance levels.
On the longer-term weekly charts ETH is now bearish. The monthlies are still clinging onto a bullish bias. But as we’ve said before, these charts take a very long time to turn.
Dash Drops by 23 Percent
Similarly to Ether, DSH/BTC had large losses too. Measured from last week’s price at 0.02825 BTC the coin fell by 22.6 percent to hit a new 2018 low at 0.02186 BTC. We are currently quoted at 0.02423 BTC, a fall of ‘only’ 14 percent compared to last Thursday.
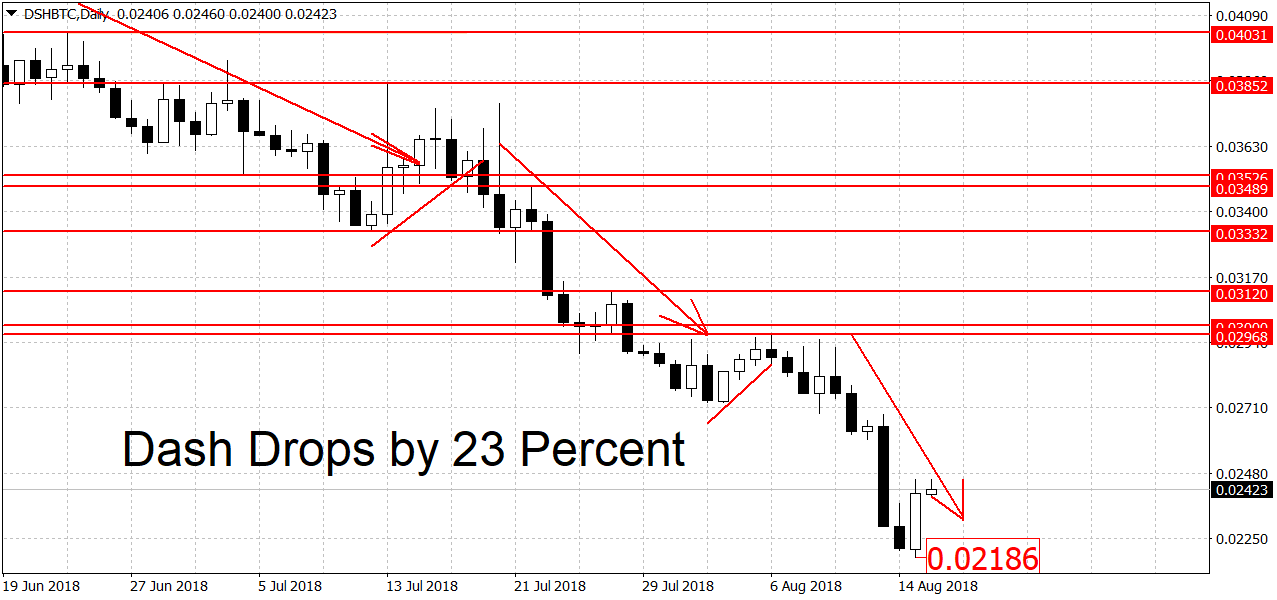
Dash remains in a downtrend on the daily charts. A breakout above the 0.03 round figure is needed to end it. Slightly below here we have a former swing high at 0.02968 BTC which may act as resistance. The bulls need a break above the next swing high at 0.03120 BTC to start a new rally.
Despite the most recent large decline in prices, there’s no change in trends on the longer-term charts. Dash is bearish on the weeklies but still neutral on the monthly charts.
Open a Crypto account and start BTC Forex trading with FXOpen.
FXOpen offers the world's most popular cryptocurrency CFDs*, including Bitcoin and Ethereum. Floating spreads, 1:2 leverage — at your service (additional fees may apply). Open your trading account now or learn more about crypto CFD trading with FXOpen.
*Important: At FXOpen UK, Cryptocurrency trading via CFDs is only available to our Professional clients. They are not available for trading by Retail clients. To find out more information about how this may affect you, please get in touch with our team.
This article represents the opinion of the Companies operating under the FXOpen brand only. It is not to be construed as an offer, solicitation, or recommendation with respect to products and services provided by the Companies operating under the FXOpen brand, nor is it to be considered financial advice.
Stay ahead of the market!
Subscribe now to our mailing list and receive the latest market news and insights delivered directly to your inbox.


Latest articles

EUR/USD Eyes Gains As USD/CHF Weakness Deepens Again
EUR/USD started a fresh increase above 1.1700 and 1.1720. USD/CHF declined further and is now struggling below 0.7835.
Important Takeaways for EUR/USD and USD/CHF Analysis Today
· The Euro started a decent increase from

Apple: Earnings Day Above the Activity Zone
On 30 April, after the market close, Apple Inc. will release its financial results for the second quarter of fiscal 2026. The consensus forecast, based on estimates from 31 analysts, points to revenue of around $109.7 billion, with expected

USD/JPY and USD/CHF Near Key Levels: The Dollar Supported by the Fed
The US dollar continues to trend upwards following the Federal Reserve meeting, drawing support from the regulator’s moderately hawkish stance and comments by Jerome Powell. Markets interpret the Fed’s rhetoric as a signal that restrictive policy is likely