


Ether, Dash Downtrends Continue
FXOpen

The downtrends in both Ether and Dash are continuing. Both cryptos have made new lows since our update last Thursday.
Ether Downtrend Continues
Ether keeps making new lows versus BTC, trading at 0.05 BTC, down from 0.053 BTC last week. We traded as low as 0.04661 going into the bitcoin fork. People dumped everything to buy BTC in order to receive the ‘free dividend’. These money flows got sharply reversed post-fork on October 24th when prices spiked to a high of 0.05545 BTC. But these highs were quickly sold into and we are quoted near the 0.05 round figure again.
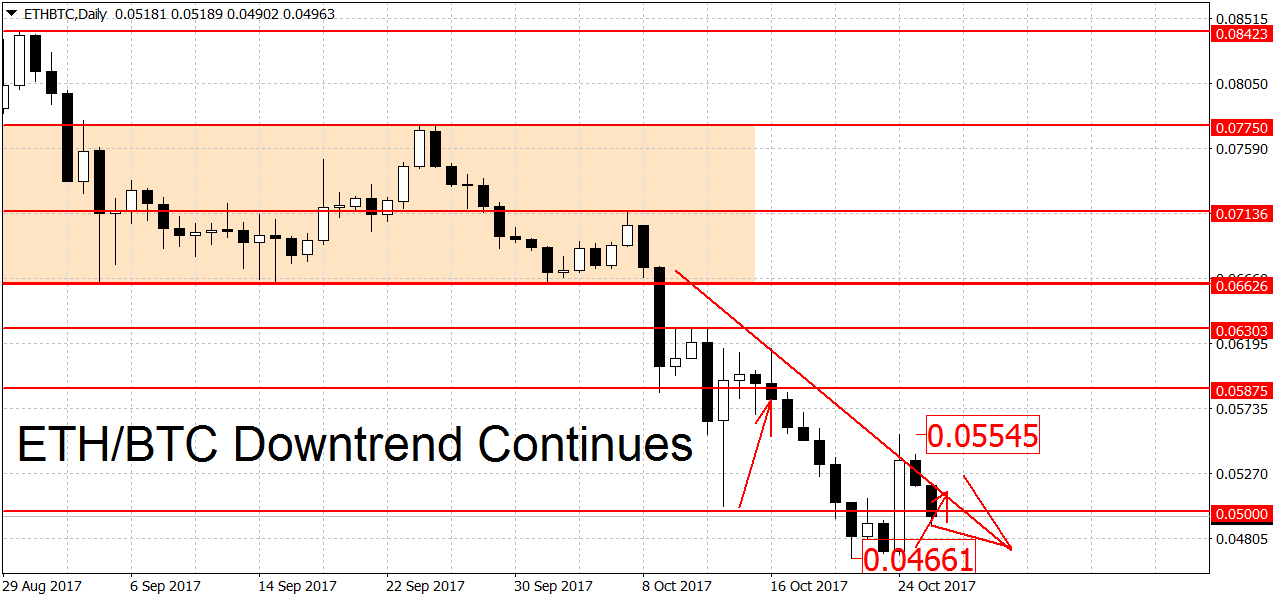
The downtrend is still in place. To end it the bulls will have to push ETH/BTC above the 0.05875 BTC level. A new rally requires a breakout above the 0.07136 BTC swing high. On the lower end, we find weak support at this month’s low of 0.04661 BTC, followed by the 0.04405 swing low. Further down we have another round level at 0.04 and the 2016 high at 0.03720 BTC. Lower still we find a strong support area consisting of the 0.03409 swing high and the 0.03383 swing lows. A clearing of this area could lead to more ETH losses.
On the longer-term charts, we have a change. The weekly chart switched from range-bound to bearish. The monthlies remain in rally mode but note that these charts may take many months to switch allegiance.
New Lows for Dash
Similarly to ETH, Dash keeps making new monthly lows versus big brother. During the past seven days, a low of 0.0442 BTC was hit, matching the lows seen back in August of this year. We are currently trading at 0.04783, down from 0.05054 last Thursday. This is a loss in value of 5.3 percent.
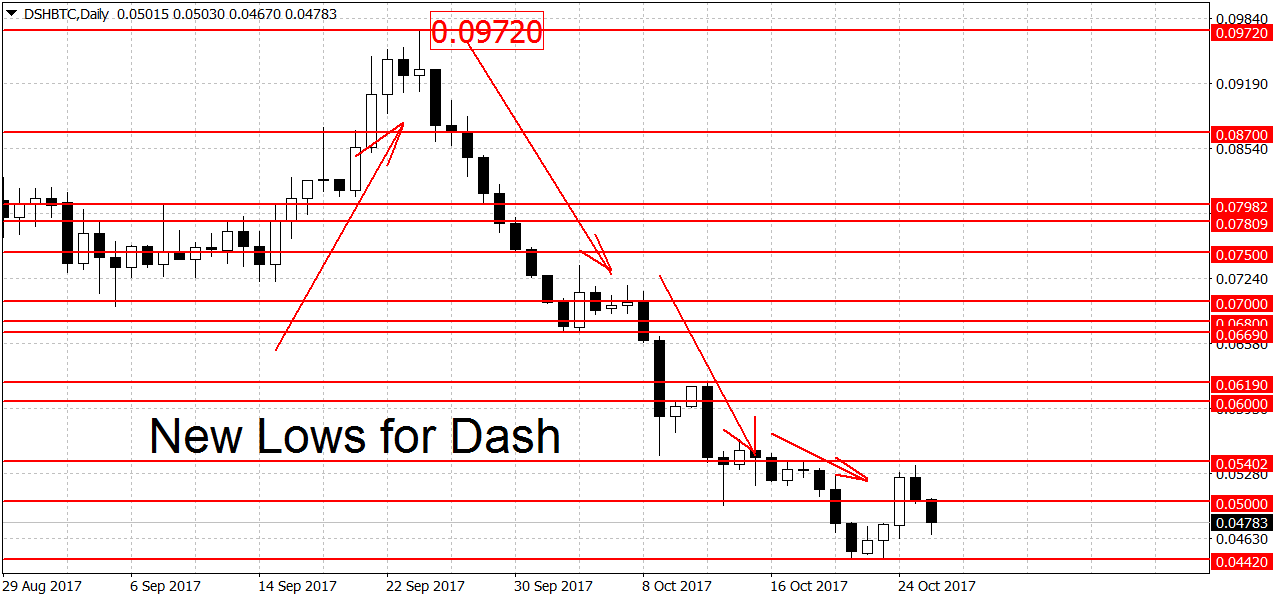
The 0.0442 double bottom coupled with another former swing low at 0.043 BTC now form a strong support area. A decisive break below here could open the door for larger losses in DSH/BTC. On the upside, the bulls need a break of the 0.05402 swing high to end the downtrend. A move beyond the 0.07 BTC round figure is needed for a new rally. You can see more potential support/resistance levels on our chart above.
On the longer-term charts, the picture is unchanged. Both the weeklies and the monthlies remain in an uptrend.
Start trading Bitcoin, Ethereum or Dash with cryptocurrency broker FXOpen.
FXOpen offers the world's most popular cryptocurrency CFDs*, including Bitcoin and Ethereum. Floating spreads, 1:2 leverage — at your service (additional fees may apply). Open your trading account now or learn more about crypto CFD trading with FXOpen.
*Important: At FXOpen UK, Cryptocurrency trading via CFDs is only available to our Professional clients. They are not available for trading by Retail clients. To find out more information about how this may affect you, please get in touch with our team.
This article represents the opinion of the Companies operating under the FXOpen brand only. It is not to be construed as an offer, solicitation, or recommendation with respect to products and services provided by the Companies operating under the FXOpen brand, nor is it to be considered financial advice.
Stay ahead of the market!
Subscribe now to our mailing list and receive the latest market news and insights delivered directly to your inbox.


Latest articles

EUR/USD Eyes Gains As USD/CHF Weakness Deepens Again
EUR/USD started a fresh increase above 1.1700 and 1.1720. USD/CHF declined further and is now struggling below 0.7835.
Important Takeaways for EUR/USD and USD/CHF Analysis Today
· The Euro started a decent increase from

Apple: Earnings Day Above the Activity Zone
On 30 April, after the market close, Apple Inc. will release its financial results for the second quarter of fiscal 2026. The consensus forecast, based on estimates from 31 analysts, points to revenue of around $109.7 billion, with expected

USD/JPY and USD/CHF Near Key Levels: The Dollar Supported by the Fed
The US dollar continues to trend upwards following the Federal Reserve meeting, drawing support from the regulator’s moderately hawkish stance and comments by Jerome Powell. Markets interpret the Fed’s rhetoric as a signal that restrictive policy is likely